Immigrants from Croatia vs Canadian Single Female Poverty
COMPARE
Immigrants from Croatia
Canadian
Single Female Poverty
Single Female Poverty Comparison
Immigrants from Croatia
Canadians
18.9%
SINGLE FEMALE POVERTY
99.9/ 100
METRIC RATING
44th/ 347
METRIC RANK
21.1%
SINGLE FEMALE POVERTY
45.4/ 100
METRIC RATING
176th/ 347
METRIC RANK
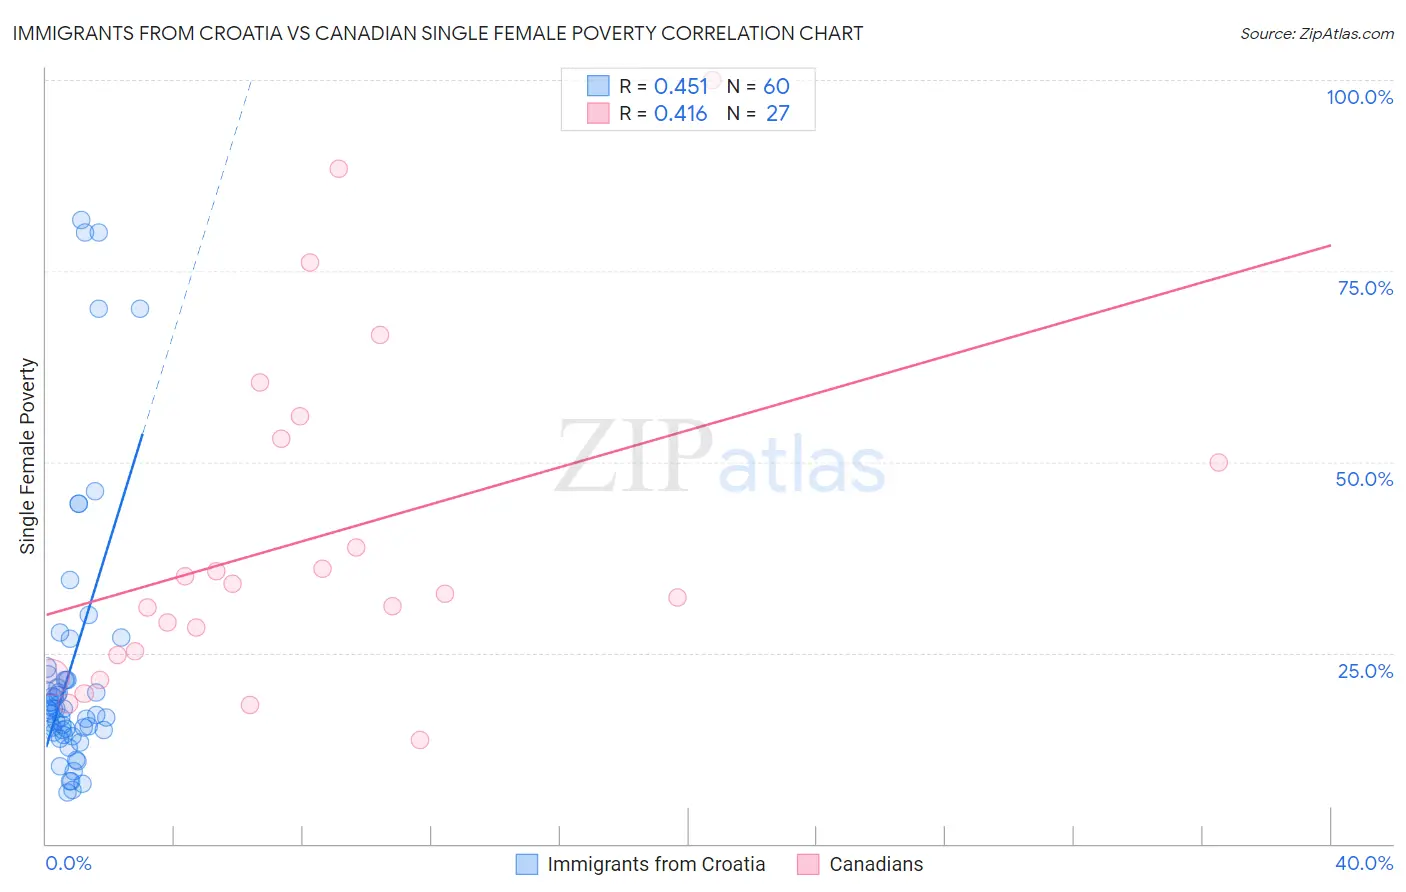
Immigrants from Croatia vs Canadian Single Female Poverty Correlation Chart
The statistical analysis conducted on geographies consisting of 131,494,560 people shows a moderate positive correlation between the proportion of Immigrants from Croatia and poverty level among single females in the United States with a correlation coefficient (R) of 0.451 and weighted average of 18.9%. Similarly, the statistical analysis conducted on geographies consisting of 428,352,495 people shows a moderate positive correlation between the proportion of Canadians and poverty level among single females in the United States with a correlation coefficient (R) of 0.416 and weighted average of 21.1%, a difference of 11.6%.
Single Female Poverty Correlation Summary
| Measurement | Immigrants from Croatia | Canadian |
| Minimum | 6.7% | 13.6% |
| Maximum | 81.7% | 100.0% |
| Range | 74.9% | 86.4% |
| Mean | 23.4% | 39.9% |
| Median | 17.6% | 32.8% |
| Interquartile 25% (IQ1) | 14.7% | 24.7% |
| Interquartile 75% (IQ3) | 21.8% | 53.0% |
| Interquartile Range (IQR) | 7.1% | 28.3% |
| Standard Deviation (Sample) | 18.1% | 22.1% |
| Standard Deviation (Population) | 18.0% | 21.7% |
Similar Demographics by Single Female Poverty
Demographics Similar to Immigrants from Croatia by Single Female Poverty
In terms of single female poverty, the demographic groups most similar to Immigrants from Croatia are Immigrants from Romania (18.8%, a difference of 0.17%), Immigrants from Indonesia (18.9%, a difference of 0.21%), Jordanian (18.8%, a difference of 0.32%), Macedonian (18.9%, a difference of 0.38%), and Immigrants from Serbia (18.8%, a difference of 0.40%).
| Demographics | Rating | Rank | Single Female Poverty |
| Immigrants | Armenia | 99.9 /100 | #37 | Exceptional 18.7% |
| Tongans | 99.9 /100 | #38 | Exceptional 18.8% |
| Bulgarians | 99.9 /100 | #39 | Exceptional 18.8% |
| Okinawans | 99.9 /100 | #40 | Exceptional 18.8% |
| Immigrants | Serbia | 99.9 /100 | #41 | Exceptional 18.8% |
| Jordanians | 99.9 /100 | #42 | Exceptional 18.8% |
| Immigrants | Romania | 99.9 /100 | #43 | Exceptional 18.8% |
| Immigrants | Croatia | 99.9 /100 | #44 | Exceptional 18.9% |
| Immigrants | Indonesia | 99.8 /100 | #45 | Exceptional 18.9% |
| Macedonians | 99.8 /100 | #46 | Exceptional 18.9% |
| Latvians | 99.8 /100 | #47 | Exceptional 19.0% |
| Immigrants | Argentina | 99.8 /100 | #48 | Exceptional 19.0% |
| Immigrants | Czechoslovakia | 99.8 /100 | #49 | Exceptional 19.0% |
| Immigrants | Eastern Europe | 99.8 /100 | #50 | Exceptional 19.0% |
| Immigrants | Italy | 99.8 /100 | #51 | Exceptional 19.0% |
Demographics Similar to Canadians by Single Female Poverty
In terms of single female poverty, the demographic groups most similar to Canadians are Scandinavian (21.1%, a difference of 0.010%), Immigrants from Bosnia and Herzegovina (21.1%, a difference of 0.040%), Czech (21.0%, a difference of 0.080%), British (21.1%, a difference of 0.16%), and Spanish American Indian (21.1%, a difference of 0.19%).
| Demographics | Rating | Rank | Single Female Poverty |
| Immigrants | Trinidad and Tobago | 56.3 /100 | #169 | Average 20.9% |
| New Zealanders | 53.2 /100 | #170 | Average 21.0% |
| Moroccans | 52.8 /100 | #171 | Average 21.0% |
| Guyanese | 52.0 /100 | #172 | Average 21.0% |
| Immigrants | Guyana | 50.6 /100 | #173 | Average 21.0% |
| Cubans | 50.0 /100 | #174 | Average 21.0% |
| Czechs | 46.8 /100 | #175 | Average 21.0% |
| Canadians | 45.4 /100 | #176 | Average 21.1% |
| Scandinavians | 45.2 /100 | #177 | Average 21.1% |
| Immigrants | Bosnia and Herzegovina | 44.9 /100 | #178 | Average 21.1% |
| British | 42.9 /100 | #179 | Average 21.1% |
| Spanish American Indians | 42.5 /100 | #180 | Average 21.1% |
| Europeans | 42.3 /100 | #181 | Average 21.1% |
| Slavs | 40.5 /100 | #182 | Average 21.1% |
| Slovaks | 39.7 /100 | #183 | Fair 21.1% |