Immigrants from Congo vs Welsh 1st Grade
COMPARE
Immigrants from Congo
Welsh
1st Grade
1st Grade Comparison
Immigrants from Congo
Welsh
97.5%
1ST GRADE
0.7/ 100
METRIC RATING
253rd/ 347
METRIC RANK
98.9%
1ST GRADE
100.0/ 100
METRIC RATING
4th/ 347
METRIC RANK
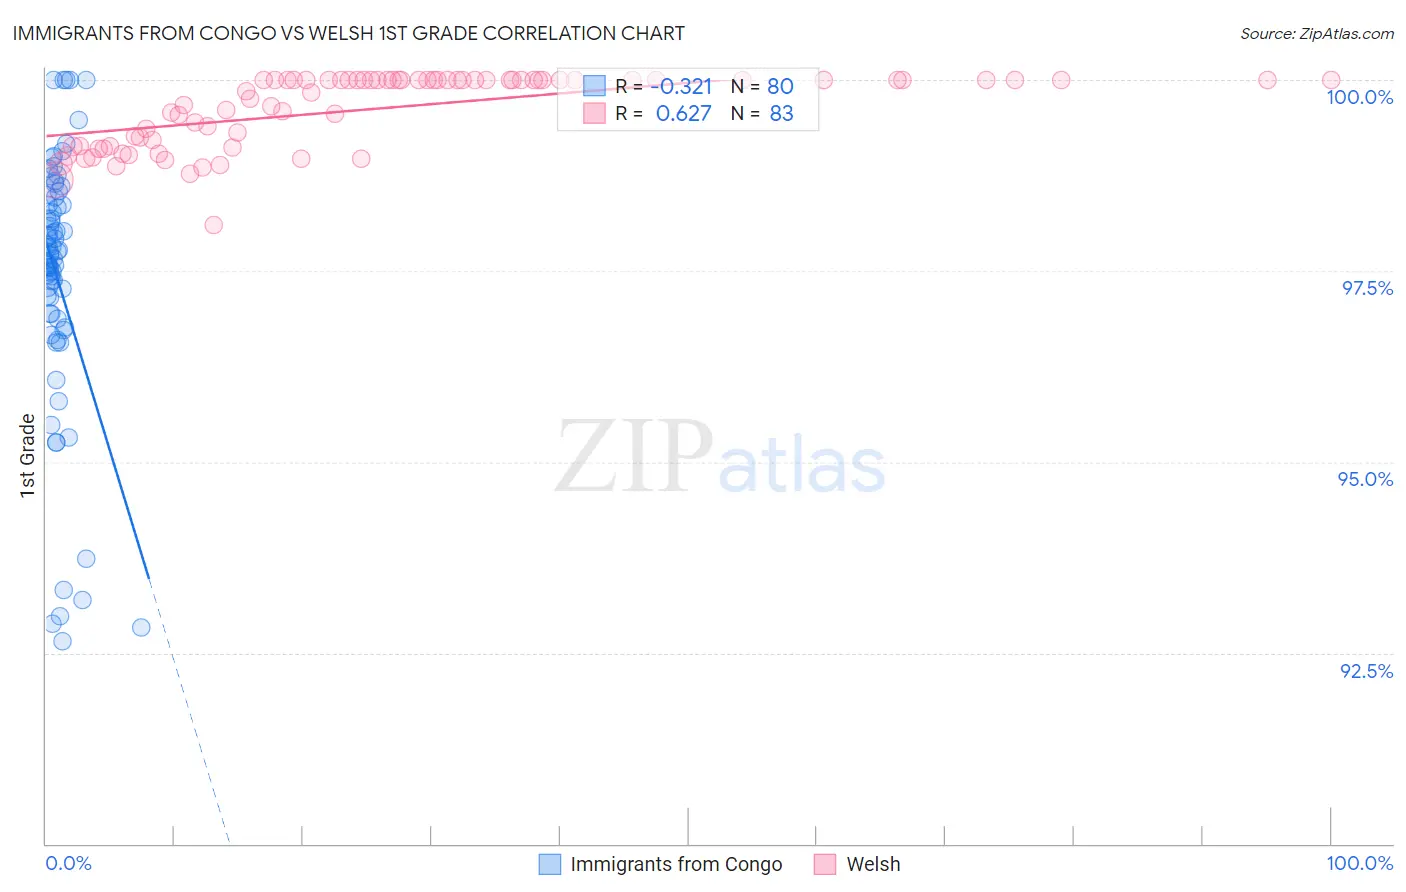
Immigrants from Congo vs Welsh 1st Grade Correlation Chart
The statistical analysis conducted on geographies consisting of 92,124,753 people shows a mild negative correlation between the proportion of Immigrants from Congo and percentage of population with at least 1st grade education in the United States with a correlation coefficient (R) of -0.321 and weighted average of 97.5%. Similarly, the statistical analysis conducted on geographies consisting of 239,962,401 people shows a significant positive correlation between the proportion of Welsh and percentage of population with at least 1st grade education in the United States with a correlation coefficient (R) of 0.627 and weighted average of 98.9%, a difference of 1.3%.
1st Grade Correlation Summary
| Measurement | Immigrants from Congo | Welsh |
| Minimum | 92.6% | 98.1% |
| Maximum | 100.0% | 100.0% |
| Range | 7.4% | 1.9% |
| Mean | 97.4% | 99.6% |
| Median | 97.7% | 100.0% |
| Interquartile 25% (IQ1) | 96.9% | 99.1% |
| Interquartile 75% (IQ3) | 98.4% | 100.0% |
| Interquartile Range (IQR) | 1.5% | 0.87% |
| Standard Deviation (Sample) | 1.7% | 0.47% |
| Standard Deviation (Population) | 1.7% | 0.47% |
Similar Demographics by 1st Grade
Demographics Similar to Immigrants from Congo by 1st Grade
In terms of 1st grade, the demographic groups most similar to Immigrants from Congo are Immigrants from Asia (97.5%, a difference of 0.0%), Immigrants from Africa (97.6%, a difference of 0.010%), Immigrants from Colombia (97.5%, a difference of 0.010%), Jamaican (97.5%, a difference of 0.010%), and Ethiopian (97.6%, a difference of 0.020%).
| Demographics | Rating | Rank | 1st Grade |
| Immigrants | Eastern Africa | 1.0 /100 | #246 | Tragic 97.6% |
| Peruvians | 1.0 /100 | #247 | Tragic 97.6% |
| Immigrants | Middle Africa | 1.0 /100 | #248 | Tragic 97.6% |
| Immigrants | Senegal | 1.0 /100 | #249 | Tragic 97.6% |
| Ethiopians | 0.9 /100 | #250 | Tragic 97.6% |
| Immigrants | Iraq | 0.9 /100 | #251 | Tragic 97.6% |
| Immigrants | Africa | 0.9 /100 | #252 | Tragic 97.6% |
| Immigrants | Congo | 0.7 /100 | #253 | Tragic 97.5% |
| Immigrants | Asia | 0.7 /100 | #254 | Tragic 97.5% |
| Immigrants | Colombia | 0.6 /100 | #255 | Tragic 97.5% |
| Jamaicans | 0.6 /100 | #256 | Tragic 97.5% |
| Yaqui | 0.6 /100 | #257 | Tragic 97.5% |
| Indians (Asian) | 0.6 /100 | #258 | Tragic 97.5% |
| Fijians | 0.5 /100 | #259 | Tragic 97.5% |
| Armenians | 0.5 /100 | #260 | Tragic 97.5% |
Demographics Similar to Welsh by 1st Grade
In terms of 1st grade, the demographic groups most similar to Welsh are Inupiat (98.9%, a difference of 0.010%), Tsimshian (98.8%, a difference of 0.030%), Alaskan Athabascan (98.8%, a difference of 0.080%), Alaska Native (98.7%, a difference of 0.13%), and Norwegian (98.7%, a difference of 0.15%).
| Demographics | Rating | Rank | 1st Grade |
| Crow | 100.0 /100 | #1 | Exceptional 99.6% |
| Yup'ik | 100.0 /100 | #2 | Exceptional 99.2% |
| Inupiat | 100.0 /100 | #3 | Exceptional 98.9% |
| Welsh | 100.0 /100 | #4 | Exceptional 98.9% |
| Tsimshian | 100.0 /100 | #5 | Exceptional 98.8% |
| Alaskan Athabascans | 100.0 /100 | #6 | Exceptional 98.8% |
| Alaska Natives | 100.0 /100 | #7 | Exceptional 98.7% |
| Norwegians | 100.0 /100 | #8 | Exceptional 98.7% |
| Slovaks | 100.0 /100 | #9 | Exceptional 98.7% |
| Germans | 100.0 /100 | #10 | Exceptional 98.7% |
| Tlingit-Haida | 100.0 /100 | #11 | Exceptional 98.7% |
| Slovenes | 100.0 /100 | #12 | Exceptional 98.7% |
| Carpatho Rusyns | 100.0 /100 | #13 | Exceptional 98.6% |
| English | 100.0 /100 | #14 | Exceptional 98.6% |
| Swedes | 100.0 /100 | #15 | Exceptional 98.6% |