Immigrants from China vs Immigrants from Hungary Child Poverty Among Girls Under 16
COMPARE
Immigrants from China
Immigrants from Hungary
Child Poverty Among Girls Under 16
Child Poverty Among Girls Under 16 Comparison
Immigrants from China
Immigrants from Hungary
13.4%
CHILD POVERTY AMONG GIRLS UNDER 16
99.8/ 100
METRIC RATING
25th/ 347
METRIC RANK
15.8%
CHILD POVERTY AMONG GIRLS UNDER 16
80.9/ 100
METRIC RATING
149th/ 347
METRIC RANK
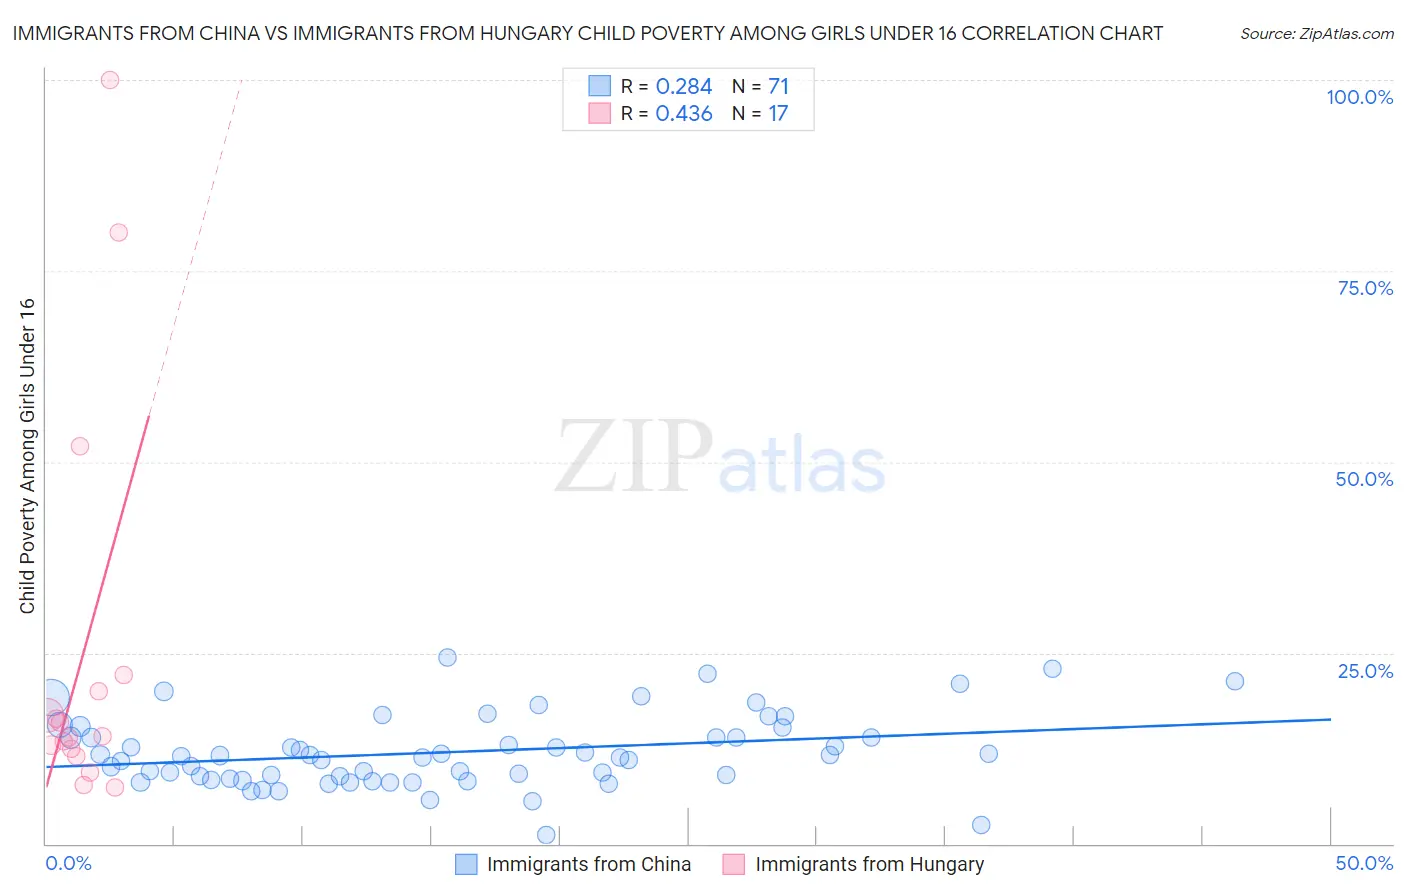
Immigrants from China vs Immigrants from Hungary Child Poverty Among Girls Under 16 Correlation Chart
The statistical analysis conducted on geographies consisting of 445,396,670 people shows a weak positive correlation between the proportion of Immigrants from China and poverty level among girls under the age of 16 in the United States with a correlation coefficient (R) of 0.284 and weighted average of 13.4%. Similarly, the statistical analysis conducted on geographies consisting of 193,307,039 people shows a moderate positive correlation between the proportion of Immigrants from Hungary and poverty level among girls under the age of 16 in the United States with a correlation coefficient (R) of 0.436 and weighted average of 15.8%, a difference of 17.6%.
Child Poverty Among Girls Under 16 Correlation Summary
| Measurement | Immigrants from China | Immigrants from Hungary |
| Minimum | 1.1% | 7.3% |
| Maximum | 24.4% | 100.0% |
| Range | 23.3% | 92.7% |
| Mean | 12.0% | 25.0% |
| Median | 11.4% | 14.0% |
| Interquartile 25% (IQ1) | 8.6% | 12.0% |
| Interquartile 75% (IQ3) | 14.0% | 21.1% |
| Interquartile Range (IQR) | 5.4% | 9.1% |
| Standard Deviation (Sample) | 4.7% | 26.6% |
| Standard Deviation (Population) | 4.7% | 25.9% |
Similar Demographics by Child Poverty Among Girls Under 16
Demographics Similar to Immigrants from China by Child Poverty Among Girls Under 16
In terms of child poverty among girls under 16, the demographic groups most similar to Immigrants from China are Immigrants from Eastern Asia (13.4%, a difference of 0.46%), Norwegian (13.3%, a difference of 0.55%), Indian (Asian) (13.3%, a difference of 0.72%), Eastern European (13.5%, a difference of 0.78%), and Latvian (13.5%, a difference of 0.81%).
| Demographics | Rating | Rank | Child Poverty Among Girls Under 16 |
| Immigrants | Korea | 99.9 /100 | #18 | Exceptional 13.1% |
| Cypriots | 99.9 /100 | #19 | Exceptional 13.2% |
| Immigrants | Japan | 99.9 /100 | #20 | Exceptional 13.3% |
| Assyrians/Chaldeans/Syriacs | 99.9 /100 | #21 | Exceptional 13.3% |
| Indians (Asian) | 99.9 /100 | #22 | Exceptional 13.3% |
| Norwegians | 99.9 /100 | #23 | Exceptional 13.3% |
| Immigrants | Eastern Asia | 99.9 /100 | #24 | Exceptional 13.4% |
| Immigrants | China | 99.8 /100 | #25 | Exceptional 13.4% |
| Eastern Europeans | 99.8 /100 | #26 | Exceptional 13.5% |
| Latvians | 99.8 /100 | #27 | Exceptional 13.5% |
| Tongans | 99.8 /100 | #28 | Exceptional 13.6% |
| Bolivians | 99.8 /100 | #29 | Exceptional 13.6% |
| Asians | 99.7 /100 | #30 | Exceptional 13.7% |
| Turks | 99.7 /100 | #31 | Exceptional 13.7% |
| Danes | 99.7 /100 | #32 | Exceptional 13.7% |
Demographics Similar to Immigrants from Hungary by Child Poverty Among Girls Under 16
In terms of child poverty among girls under 16, the demographic groups most similar to Immigrants from Hungary are Immigrants from Albania (15.8%, a difference of 0.040%), Venezuelan (15.8%, a difference of 0.14%), Immigrants from Kuwait (15.8%, a difference of 0.28%), Icelander (15.7%, a difference of 0.32%), and Immigrants from Nepal (15.9%, a difference of 0.44%).
| Demographics | Rating | Rank | Child Poverty Among Girls Under 16 |
| Canadians | 87.1 /100 | #142 | Excellent 15.6% |
| Immigrants | Peru | 86.6 /100 | #143 | Excellent 15.6% |
| Israelis | 86.3 /100 | #144 | Excellent 15.6% |
| Welsh | 85.4 /100 | #145 | Excellent 15.6% |
| Samoans | 84.2 /100 | #146 | Excellent 15.7% |
| Slavs | 83.1 /100 | #147 | Excellent 15.7% |
| Icelanders | 82.4 /100 | #148 | Excellent 15.7% |
| Immigrants | Hungary | 80.9 /100 | #149 | Excellent 15.8% |
| Immigrants | Albania | 80.7 /100 | #150 | Excellent 15.8% |
| Venezuelans | 80.1 /100 | #151 | Excellent 15.8% |
| Immigrants | Kuwait | 79.4 /100 | #152 | Good 15.8% |
| Immigrants | Nepal | 78.5 /100 | #153 | Good 15.9% |
| Immigrants | Chile | 76.7 /100 | #154 | Good 15.9% |
| Syrians | 76.7 /100 | #155 | Good 15.9% |
| Immigrants | Fiji | 76.1 /100 | #156 | Good 15.9% |