Immigrants from Ecuador vs Immigrants from Hungary Child Poverty Among Girls Under 16
COMPARE
Immigrants from Ecuador
Immigrants from Hungary
Child Poverty Among Girls Under 16
Child Poverty Among Girls Under 16 Comparison
Immigrants from Ecuador
Immigrants from Hungary
19.3%
CHILD POVERTY AMONG GIRLS UNDER 16
0.3/ 100
METRIC RATING
255th/ 347
METRIC RANK
15.8%
CHILD POVERTY AMONG GIRLS UNDER 16
80.9/ 100
METRIC RATING
149th/ 347
METRIC RANK
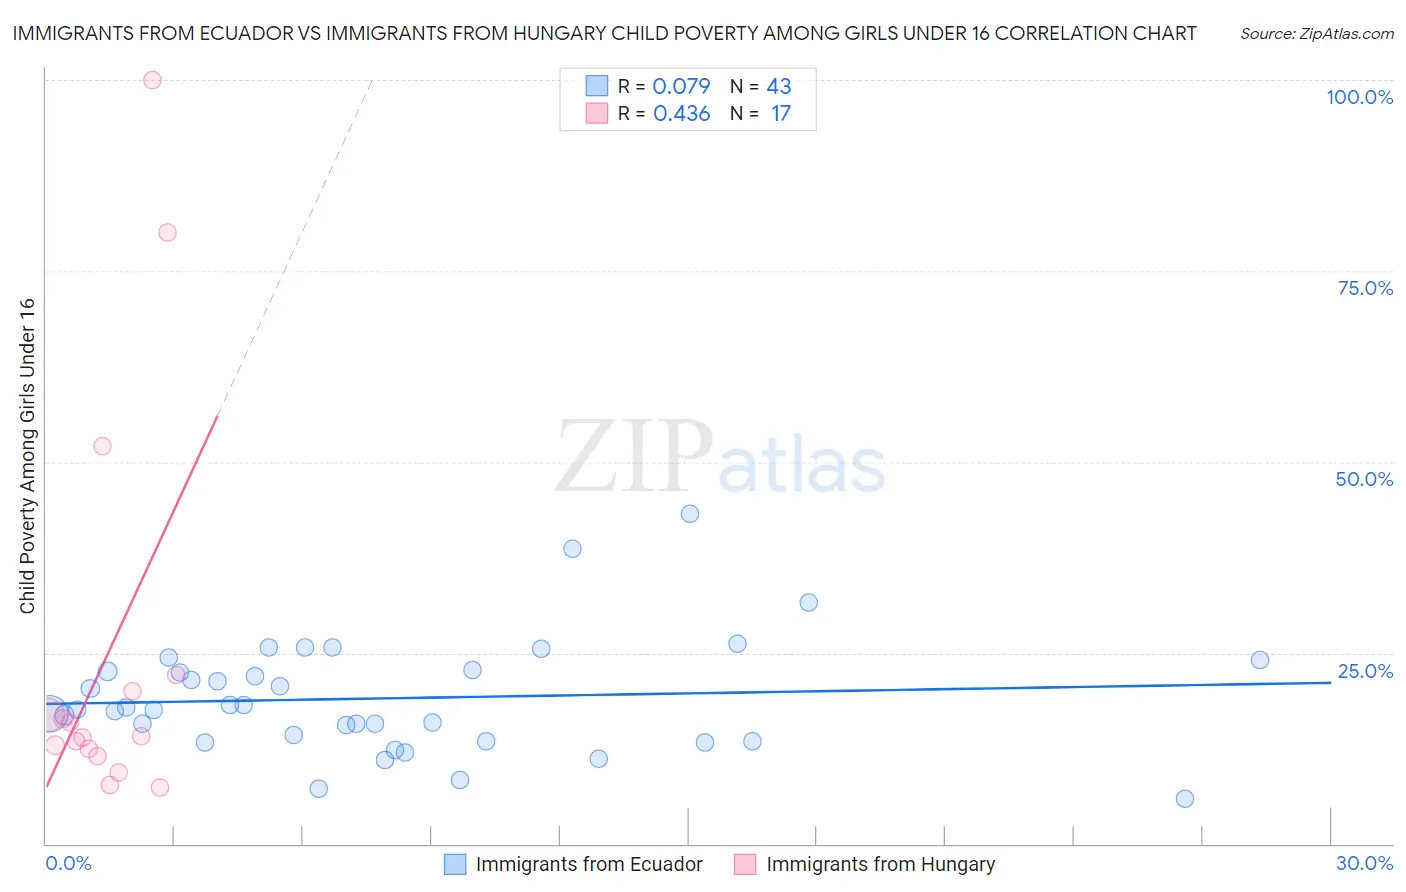
Immigrants from Ecuador vs Immigrants from Hungary Child Poverty Among Girls Under 16 Correlation Chart
The statistical analysis conducted on geographies consisting of 267,531,400 people shows a slight positive correlation between the proportion of Immigrants from Ecuador and poverty level among girls under the age of 16 in the United States with a correlation coefficient (R) of 0.079 and weighted average of 19.3%. Similarly, the statistical analysis conducted on geographies consisting of 193,307,039 people shows a moderate positive correlation between the proportion of Immigrants from Hungary and poverty level among girls under the age of 16 in the United States with a correlation coefficient (R) of 0.436 and weighted average of 15.8%, a difference of 22.2%.
Child Poverty Among Girls Under 16 Correlation Summary
| Measurement | Immigrants from Ecuador | Immigrants from Hungary |
| Minimum | 5.9% | 7.3% |
| Maximum | 43.2% | 100.0% |
| Range | 37.3% | 92.7% |
| Mean | 19.0% | 25.0% |
| Median | 17.6% | 14.0% |
| Interquartile 25% (IQ1) | 13.4% | 12.0% |
| Interquartile 75% (IQ3) | 22.8% | 21.1% |
| Interquartile Range (IQR) | 9.4% | 9.1% |
| Standard Deviation (Sample) | 7.5% | 26.6% |
| Standard Deviation (Population) | 7.4% | 25.9% |
Similar Demographics by Child Poverty Among Girls Under 16
Demographics Similar to Immigrants from Ecuador by Child Poverty Among Girls Under 16
In terms of child poverty among girls under 16, the demographic groups most similar to Immigrants from Ecuador are Immigrants from Western Africa (19.3%, a difference of 0.020%), Trinidadian and Tobagonian (19.3%, a difference of 0.060%), Immigrants from Guyana (19.3%, a difference of 0.080%), Immigrants from Middle Africa (19.2%, a difference of 0.28%), and Immigrants from Trinidad and Tobago (19.2%, a difference of 0.31%).
| Demographics | Rating | Rank | Child Poverty Among Girls Under 16 |
| French American Indians | 0.3 /100 | #248 | Tragic 19.2% |
| Potawatomi | 0.3 /100 | #249 | Tragic 19.2% |
| Cape Verdeans | 0.3 /100 | #250 | Tragic 19.2% |
| Immigrants | Trinidad and Tobago | 0.3 /100 | #251 | Tragic 19.2% |
| Immigrants | Middle Africa | 0.3 /100 | #252 | Tragic 19.2% |
| Immigrants | Guyana | 0.3 /100 | #253 | Tragic 19.3% |
| Immigrants | Western Africa | 0.3 /100 | #254 | Tragic 19.3% |
| Immigrants | Ecuador | 0.3 /100 | #255 | Tragic 19.3% |
| Trinidadians and Tobagonians | 0.2 /100 | #256 | Tragic 19.3% |
| Guyanese | 0.2 /100 | #257 | Tragic 19.4% |
| Salvadorans | 0.2 /100 | #258 | Tragic 19.4% |
| Ottawa | 0.2 /100 | #259 | Tragic 19.4% |
| Mexican American Indians | 0.2 /100 | #260 | Tragic 19.5% |
| Vietnamese | 0.2 /100 | #261 | Tragic 19.5% |
| Chickasaw | 0.1 /100 | #262 | Tragic 19.6% |
Demographics Similar to Immigrants from Hungary by Child Poverty Among Girls Under 16
In terms of child poverty among girls under 16, the demographic groups most similar to Immigrants from Hungary are Immigrants from Albania (15.8%, a difference of 0.040%), Venezuelan (15.8%, a difference of 0.14%), Immigrants from Kuwait (15.8%, a difference of 0.28%), Icelander (15.7%, a difference of 0.32%), and Immigrants from Nepal (15.9%, a difference of 0.44%).
| Demographics | Rating | Rank | Child Poverty Among Girls Under 16 |
| Canadians | 87.1 /100 | #142 | Excellent 15.6% |
| Immigrants | Peru | 86.6 /100 | #143 | Excellent 15.6% |
| Israelis | 86.3 /100 | #144 | Excellent 15.6% |
| Welsh | 85.4 /100 | #145 | Excellent 15.6% |
| Samoans | 84.2 /100 | #146 | Excellent 15.7% |
| Slavs | 83.1 /100 | #147 | Excellent 15.7% |
| Icelanders | 82.4 /100 | #148 | Excellent 15.7% |
| Immigrants | Hungary | 80.9 /100 | #149 | Excellent 15.8% |
| Immigrants | Albania | 80.7 /100 | #150 | Excellent 15.8% |
| Venezuelans | 80.1 /100 | #151 | Excellent 15.8% |
| Immigrants | Kuwait | 79.4 /100 | #152 | Good 15.8% |
| Immigrants | Nepal | 78.5 /100 | #153 | Good 15.9% |
| Immigrants | Chile | 76.7 /100 | #154 | Good 15.9% |
| Syrians | 76.7 /100 | #155 | Good 15.9% |
| Immigrants | Fiji | 76.1 /100 | #156 | Good 15.9% |