Pakistani vs Immigrants from Hungary Child Poverty Among Girls Under 16
COMPARE
Pakistani
Immigrants from Hungary
Child Poverty Among Girls Under 16
Child Poverty Among Girls Under 16 Comparison
Pakistanis
Immigrants from Hungary
15.3%
CHILD POVERTY AMONG GIRLS UNDER 16
92.3/ 100
METRIC RATING
120th/ 347
METRIC RANK
15.8%
CHILD POVERTY AMONG GIRLS UNDER 16
80.9/ 100
METRIC RATING
149th/ 347
METRIC RANK
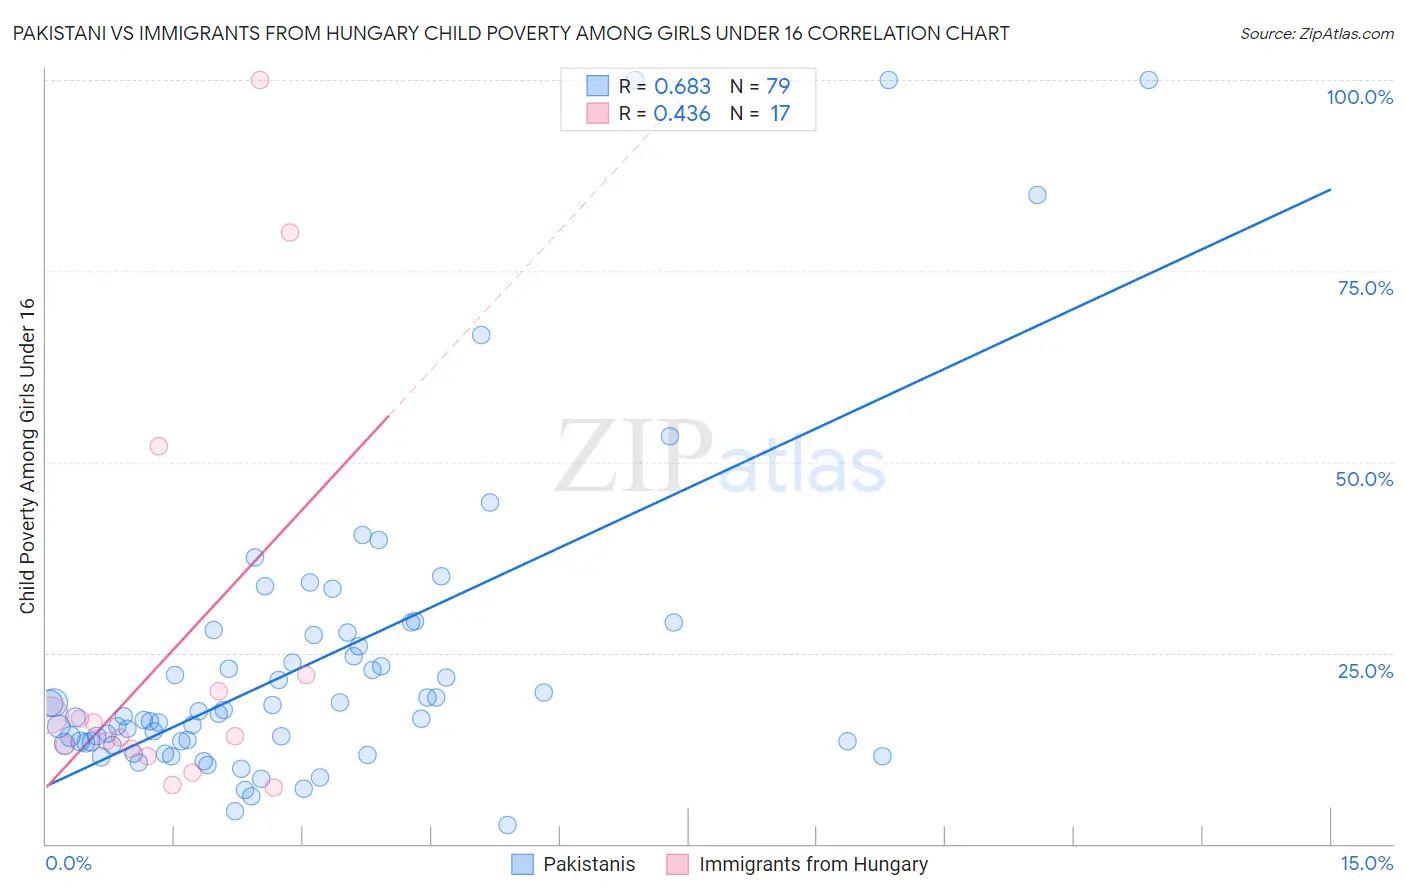
Pakistani vs Immigrants from Hungary Child Poverty Among Girls Under 16 Correlation Chart
The statistical analysis conducted on geographies consisting of 331,174,379 people shows a significant positive correlation between the proportion of Pakistanis and poverty level among girls under the age of 16 in the United States with a correlation coefficient (R) of 0.683 and weighted average of 15.3%. Similarly, the statistical analysis conducted on geographies consisting of 193,307,039 people shows a moderate positive correlation between the proportion of Immigrants from Hungary and poverty level among girls under the age of 16 in the United States with a correlation coefficient (R) of 0.436 and weighted average of 15.8%, a difference of 3.2%.
Child Poverty Among Girls Under 16 Correlation Summary
| Measurement | Pakistani | Immigrants from Hungary |
| Minimum | 2.5% | 7.3% |
| Maximum | 100.0% | 100.0% |
| Range | 97.5% | 92.7% |
| Mean | 23.5% | 25.0% |
| Median | 16.7% | 14.0% |
| Interquartile 25% (IQ1) | 13.2% | 12.0% |
| Interquartile 75% (IQ3) | 27.3% | 21.1% |
| Interquartile Range (IQR) | 14.1% | 9.1% |
| Standard Deviation (Sample) | 20.1% | 26.6% |
| Standard Deviation (Population) | 20.0% | 25.9% |
Similar Demographics by Child Poverty Among Girls Under 16
Demographics Similar to Pakistanis by Child Poverty Among Girls Under 16
In terms of child poverty among girls under 16, the demographic groups most similar to Pakistanis are English (15.3%, a difference of 0.020%), Immigrants from Zimbabwe (15.3%, a difference of 0.090%), Immigrants from Southern Europe (15.3%, a difference of 0.20%), Portuguese (15.3%, a difference of 0.21%), and Irish (15.3%, a difference of 0.31%).
| Demographics | Rating | Rank | Child Poverty Among Girls Under 16 |
| Dutch | 94.3 /100 | #113 | Exceptional 15.1% |
| Sri Lankans | 94.0 /100 | #114 | Exceptional 15.2% |
| Belgians | 93.9 /100 | #115 | Exceptional 15.2% |
| Immigrants | Denmark | 93.3 /100 | #116 | Exceptional 15.2% |
| Immigrants | North Macedonia | 93.1 /100 | #117 | Exceptional 15.2% |
| Immigrants | Southern Europe | 92.7 /100 | #118 | Exceptional 15.3% |
| Immigrants | Zimbabwe | 92.5 /100 | #119 | Exceptional 15.3% |
| Pakistanis | 92.3 /100 | #120 | Exceptional 15.3% |
| English | 92.2 /100 | #121 | Exceptional 15.3% |
| Portuguese | 91.8 /100 | #122 | Exceptional 15.3% |
| Irish | 91.5 /100 | #123 | Exceptional 15.3% |
| Carpatho Rusyns | 91.4 /100 | #124 | Exceptional 15.3% |
| Peruvians | 91.2 /100 | #125 | Exceptional 15.4% |
| Scottish | 91.0 /100 | #126 | Exceptional 15.4% |
| Immigrants | Norway | 90.8 /100 | #127 | Exceptional 15.4% |
Demographics Similar to Immigrants from Hungary by Child Poverty Among Girls Under 16
In terms of child poverty among girls under 16, the demographic groups most similar to Immigrants from Hungary are Immigrants from Albania (15.8%, a difference of 0.040%), Venezuelan (15.8%, a difference of 0.14%), Immigrants from Kuwait (15.8%, a difference of 0.28%), Icelander (15.7%, a difference of 0.32%), and Immigrants from Nepal (15.9%, a difference of 0.44%).
| Demographics | Rating | Rank | Child Poverty Among Girls Under 16 |
| Canadians | 87.1 /100 | #142 | Excellent 15.6% |
| Immigrants | Peru | 86.6 /100 | #143 | Excellent 15.6% |
| Israelis | 86.3 /100 | #144 | Excellent 15.6% |
| Welsh | 85.4 /100 | #145 | Excellent 15.6% |
| Samoans | 84.2 /100 | #146 | Excellent 15.7% |
| Slavs | 83.1 /100 | #147 | Excellent 15.7% |
| Icelanders | 82.4 /100 | #148 | Excellent 15.7% |
| Immigrants | Hungary | 80.9 /100 | #149 | Excellent 15.8% |
| Immigrants | Albania | 80.7 /100 | #150 | Excellent 15.8% |
| Venezuelans | 80.1 /100 | #151 | Excellent 15.8% |
| Immigrants | Kuwait | 79.4 /100 | #152 | Good 15.8% |
| Immigrants | Nepal | 78.5 /100 | #153 | Good 15.9% |
| Immigrants | Chile | 76.7 /100 | #154 | Good 15.9% |
| Syrians | 76.7 /100 | #155 | Good 15.9% |
| Immigrants | Fiji | 76.1 /100 | #156 | Good 15.9% |