Immigrants from China vs Immigrants from Hungary Unemployment
COMPARE
Immigrants from China
Immigrants from Hungary
Unemployment
Unemployment Comparison
Immigrants from China
Immigrants from Hungary
5.2%
UNEMPLOYMENT
74.7/ 100
METRIC RATING
154th/ 347
METRIC RANK
5.1%
UNEMPLOYMENT
85.6/ 100
METRIC RATING
138th/ 347
METRIC RANK
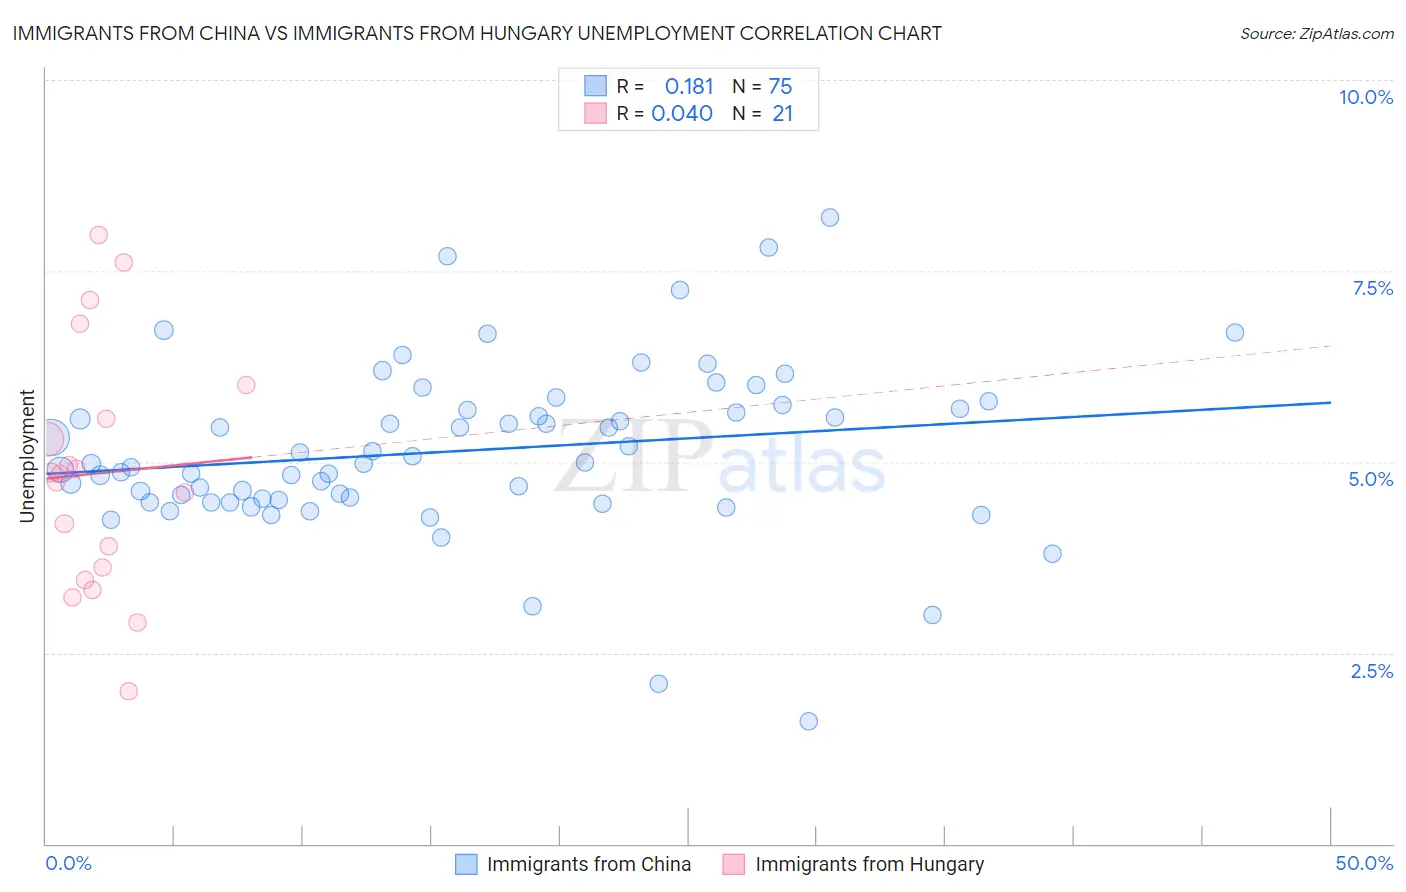
Immigrants from China vs Immigrants from Hungary Unemployment Correlation Chart
The statistical analysis conducted on geographies consisting of 456,493,067 people shows a poor positive correlation between the proportion of Immigrants from China and unemployment in the United States with a correlation coefficient (R) of 0.181 and weighted average of 5.2%. Similarly, the statistical analysis conducted on geographies consisting of 195,624,152 people shows no correlation between the proportion of Immigrants from Hungary and unemployment in the United States with a correlation coefficient (R) of 0.040 and weighted average of 5.1%, a difference of 1.1%.
Unemployment Correlation Summary
| Measurement | Immigrants from China | Immigrants from Hungary |
| Minimum | 1.6% | 2.0% |
| Maximum | 8.2% | 8.0% |
| Range | 6.6% | 6.0% |
| Mean | 5.1% | 4.9% |
| Median | 5.0% | 4.8% |
| Interquartile 25% (IQ1) | 4.5% | 3.5% |
| Interquartile 75% (IQ3) | 5.7% | 5.8% |
| Interquartile Range (IQR) | 1.2% | 2.2% |
| Standard Deviation (Sample) | 1.1% | 1.6% |
| Standard Deviation (Population) | 1.1% | 1.5% |
Demographics Similar to Immigrants from China and Immigrants from Hungary by Unemployment
In terms of unemployment, the demographic groups most similar to Immigrants from China are Immigrants from Hong Kong (5.2%, a difference of 0.040%), Egyptian (5.2%, a difference of 0.040%), Immigrants from Eastern Europe (5.2%, a difference of 0.050%), Potawatomi (5.2%, a difference of 0.12%), and Syrian (5.2%, a difference of 0.26%). Similarly, the demographic groups most similar to Immigrants from Hungary are Immigrants from Saudi Arabia (5.1%, a difference of 0.010%), Pakistani (5.1%, a difference of 0.040%), Immigrants from Spain (5.1%, a difference of 0.080%), Immigrants from Denmark (5.1%, a difference of 0.16%), and Palestinian (5.1%, a difference of 0.27%).
| Demographics | Rating | Rank | Unemployment |
| Immigrants | Spain | 86.2 /100 | #136 | Excellent 5.1% |
| Immigrants | Saudi Arabia | 85.6 /100 | #137 | Excellent 5.1% |
| Immigrants | Hungary | 85.6 /100 | #138 | Excellent 5.1% |
| Pakistanis | 85.3 /100 | #139 | Excellent 5.1% |
| Immigrants | Denmark | 84.3 /100 | #140 | Excellent 5.1% |
| Palestinians | 83.4 /100 | #141 | Excellent 5.1% |
| Immigrants | Pakistan | 83.2 /100 | #142 | Excellent 5.1% |
| Immigrants | Chile | 82.8 /100 | #143 | Excellent 5.1% |
| Indonesians | 82.3 /100 | #144 | Excellent 5.1% |
| Immigrants | Norway | 81.8 /100 | #145 | Excellent 5.1% |
| Immigrants | Asia | 81.8 /100 | #146 | Excellent 5.1% |
| Indians (Asian) | 81.6 /100 | #147 | Excellent 5.1% |
| Immigrants | Italy | 79.1 /100 | #148 | Good 5.1% |
| Syrians | 77.7 /100 | #149 | Good 5.2% |
| Potawatomi | 76.2 /100 | #150 | Good 5.2% |
| Immigrants | Eastern Europe | 75.3 /100 | #151 | Good 5.2% |
| Immigrants | Hong Kong | 75.2 /100 | #152 | Good 5.2% |
| Egyptians | 75.2 /100 | #153 | Good 5.2% |
| Immigrants | China | 74.7 /100 | #154 | Good 5.2% |
| Immigrants | Northern Africa | 71.3 /100 | #155 | Good 5.2% |
| Immigrants | Kazakhstan | 70.4 /100 | #156 | Good 5.2% |