Native Hawaiian vs Iranian Poverty
COMPARE
Native Hawaiian
Iranian
Poverty
Poverty Comparison
Native Hawaiians
Iranians
11.6%
POVERTY
92.1/ 100
METRIC RATING
104th/ 347
METRIC RANK
10.7%
POVERTY
99.5/ 100
METRIC RATING
32nd/ 347
METRIC RANK
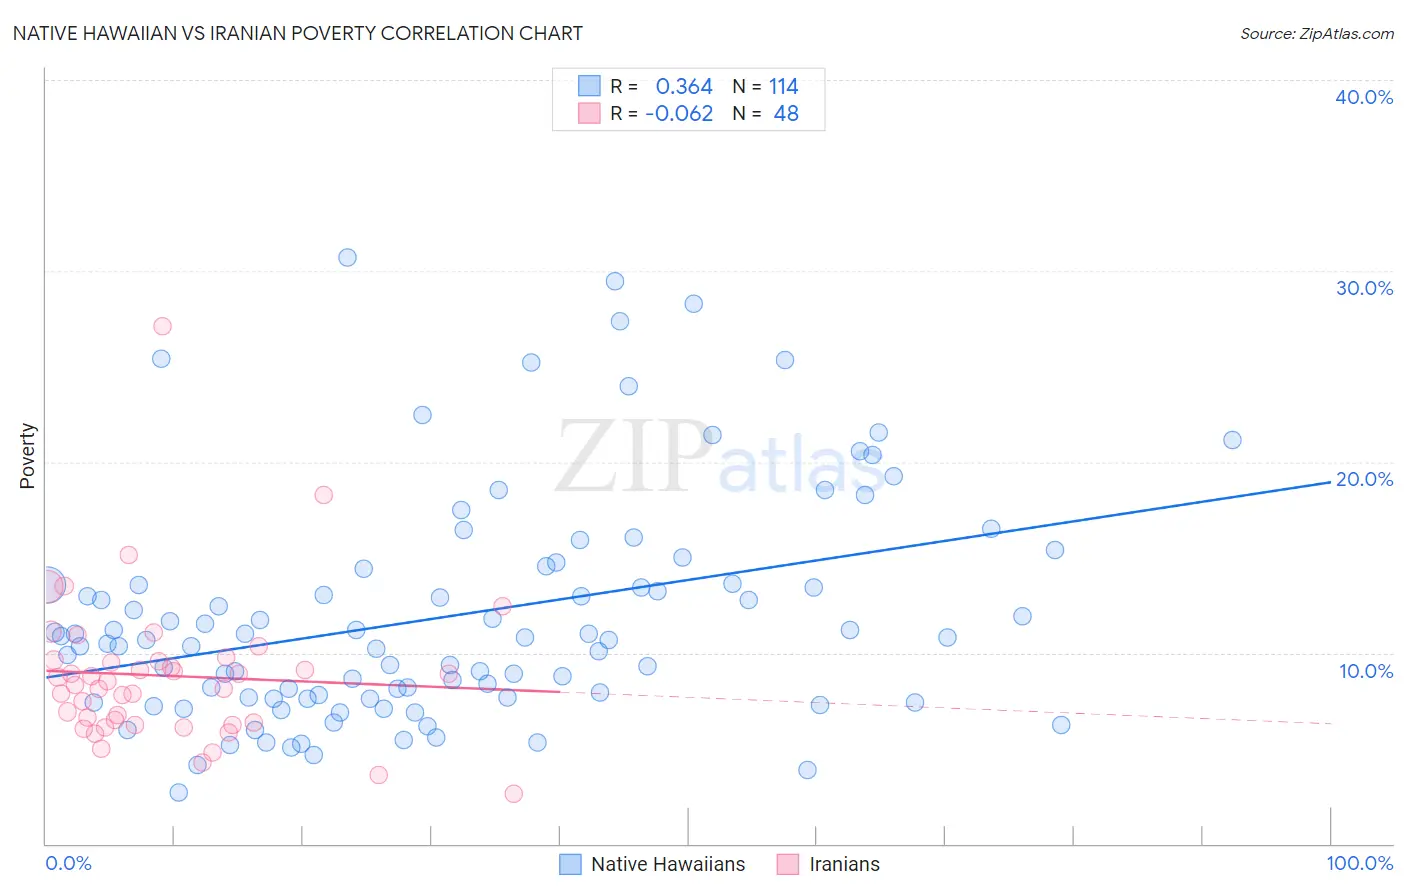
Native Hawaiian vs Iranian Poverty Correlation Chart
The statistical analysis conducted on geographies consisting of 331,880,799 people shows a mild positive correlation between the proportion of Native Hawaiians and poverty level in the United States with a correlation coefficient (R) of 0.364 and weighted average of 11.6%. Similarly, the statistical analysis conducted on geographies consisting of 316,670,706 people shows a slight negative correlation between the proportion of Iranians and poverty level in the United States with a correlation coefficient (R) of -0.062 and weighted average of 10.7%, a difference of 7.8%.
Poverty Correlation Summary
| Measurement | Native Hawaiian | Iranian |
| Minimum | 2.7% | 2.6% |
| Maximum | 30.7% | 27.1% |
| Range | 28.0% | 24.5% |
| Mean | 11.9% | 8.8% |
| Median | 10.7% | 8.4% |
| Interquartile 25% (IQ1) | 7.6% | 6.3% |
| Interquartile 75% (IQ3) | 13.6% | 9.6% |
| Interquartile Range (IQR) | 6.0% | 3.3% |
| Standard Deviation (Sample) | 5.9% | 4.0% |
| Standard Deviation (Population) | 5.9% | 3.9% |
Similar Demographics by Poverty
Demographics Similar to Native Hawaiians by Poverty
In terms of poverty, the demographic groups most similar to Native Hawaiians are Portuguese (11.6%, a difference of 0.020%), Immigrants from Zimbabwe (11.6%, a difference of 0.020%), Laotian (11.6%, a difference of 0.11%), Okinawan (11.6%, a difference of 0.11%), and Palestinian (11.6%, a difference of 0.11%).
| Demographics | Rating | Rank | Poverty |
| Immigrants | Egypt | 94.6 /100 | #97 | Exceptional 11.5% |
| Immigrants | Latvia | 94.5 /100 | #98 | Exceptional 11.5% |
| Immigrants | Indonesia | 94.2 /100 | #99 | Exceptional 11.5% |
| Scottish | 94.0 /100 | #100 | Exceptional 11.5% |
| Slavs | 93.3 /100 | #101 | Exceptional 11.5% |
| Laotians | 92.4 /100 | #102 | Exceptional 11.6% |
| Okinawans | 92.4 /100 | #103 | Exceptional 11.6% |
| Native Hawaiians | 92.1 /100 | #104 | Exceptional 11.6% |
| Portuguese | 92.1 /100 | #105 | Exceptional 11.6% |
| Immigrants | Zimbabwe | 92.1 /100 | #106 | Exceptional 11.6% |
| Palestinians | 91.8 /100 | #107 | Exceptional 11.6% |
| Canadians | 91.7 /100 | #108 | Exceptional 11.6% |
| Immigrants | Turkey | 91.7 /100 | #109 | Exceptional 11.6% |
| Welsh | 91.6 /100 | #110 | Exceptional 11.6% |
| French Canadians | 91.0 /100 | #111 | Exceptional 11.6% |
Demographics Similar to Iranians by Poverty
In terms of poverty, the demographic groups most similar to Iranians are Polish (10.7%, a difference of 0.090%), Danish (10.7%, a difference of 0.17%), Greek (10.7%, a difference of 0.18%), Immigrants from Korea (10.7%, a difference of 0.27%), and Immigrants from Northern Europe (10.7%, a difference of 0.34%).
| Demographics | Rating | Rank | Poverty |
| Croatians | 99.6 /100 | #25 | Exceptional 10.6% |
| Burmese | 99.6 /100 | #26 | Exceptional 10.7% |
| Immigrants | Northern Europe | 99.6 /100 | #27 | Exceptional 10.7% |
| Immigrants | Korea | 99.5 /100 | #28 | Exceptional 10.7% |
| Greeks | 99.5 /100 | #29 | Exceptional 10.7% |
| Danes | 99.5 /100 | #30 | Exceptional 10.7% |
| Poles | 99.5 /100 | #31 | Exceptional 10.7% |
| Iranians | 99.5 /100 | #32 | Exceptional 10.7% |
| Macedonians | 99.4 /100 | #33 | Exceptional 10.8% |
| Immigrants | Poland | 99.4 /100 | #34 | Exceptional 10.8% |
| Tongans | 99.4 /100 | #35 | Exceptional 10.8% |
| Cypriots | 99.3 /100 | #36 | Exceptional 10.8% |
| Immigrants | Greece | 99.3 /100 | #37 | Exceptional 10.8% |
| Czechs | 99.3 /100 | #38 | Exceptional 10.8% |
| Immigrants | Pakistan | 99.3 /100 | #39 | Exceptional 10.8% |