Immigrants from Korea vs Iranian Poverty
COMPARE
Immigrants from Korea
Iranian
Poverty
Poverty Comparison
Immigrants from Korea
Iranians
10.7%
POVERTY
99.5/ 100
METRIC RATING
28th/ 347
METRIC RANK
10.7%
POVERTY
99.5/ 100
METRIC RATING
32nd/ 347
METRIC RANK
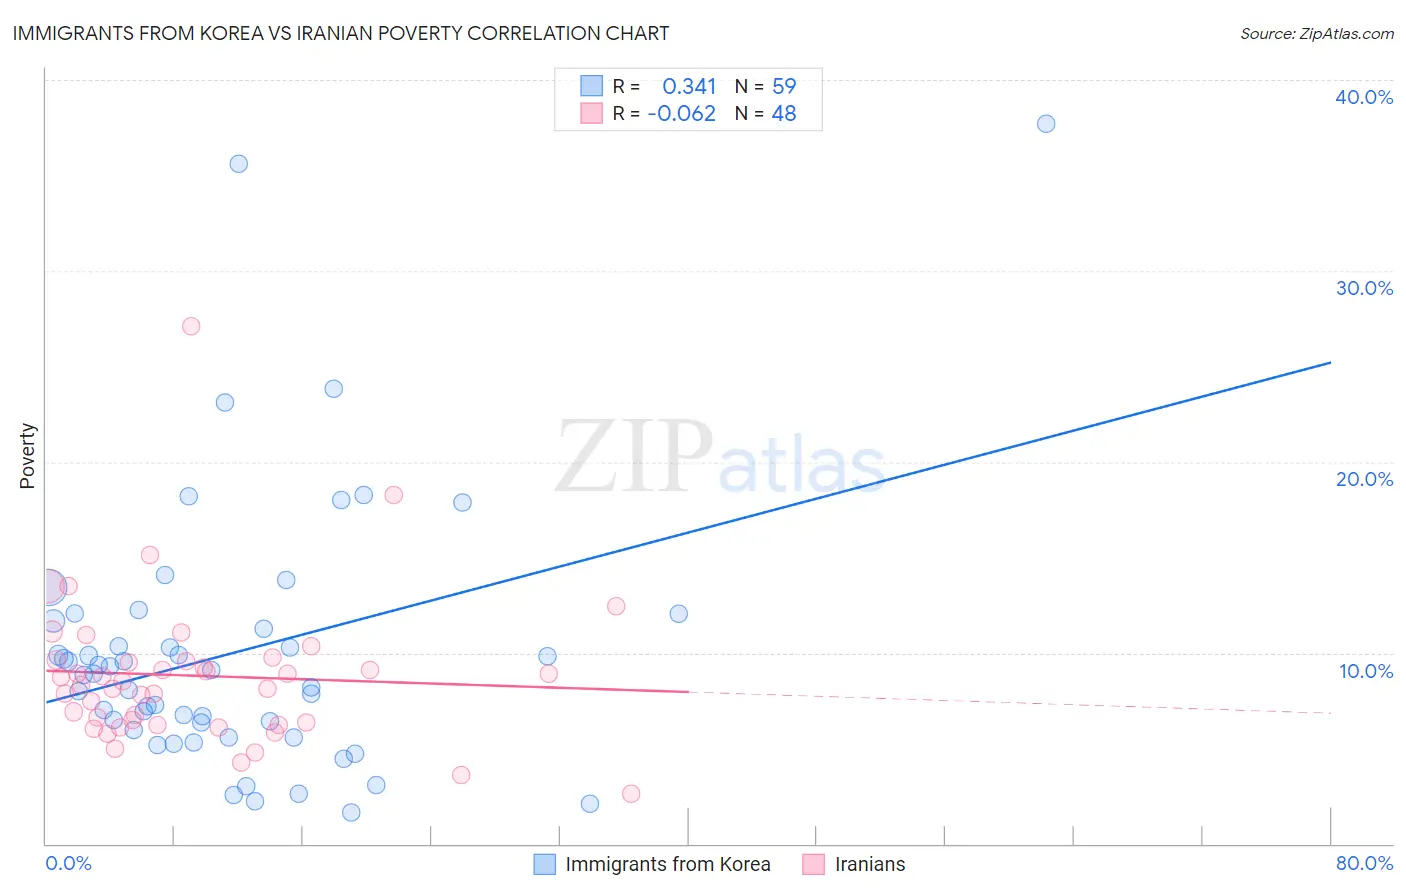
Immigrants from Korea vs Iranian Poverty Correlation Chart
The statistical analysis conducted on geographies consisting of 415,974,452 people shows a mild positive correlation between the proportion of Immigrants from Korea and poverty level in the United States with a correlation coefficient (R) of 0.341 and weighted average of 10.7%. Similarly, the statistical analysis conducted on geographies consisting of 316,670,706 people shows a slight negative correlation between the proportion of Iranians and poverty level in the United States with a correlation coefficient (R) of -0.062 and weighted average of 10.7%, a difference of 0.27%.
Poverty Correlation Summary
| Measurement | Immigrants from Korea | Iranian |
| Minimum | 1.6% | 2.6% |
| Maximum | 37.7% | 27.1% |
| Range | 36.1% | 24.5% |
| Mean | 10.0% | 8.8% |
| Median | 8.9% | 8.4% |
| Interquartile 25% (IQ1) | 5.9% | 6.3% |
| Interquartile 75% (IQ3) | 11.7% | 9.6% |
| Interquartile Range (IQR) | 5.7% | 3.3% |
| Standard Deviation (Sample) | 7.0% | 4.0% |
| Standard Deviation (Population) | 6.9% | 3.9% |
Demographics Similar to Immigrants from Korea and Iranians by Poverty
In terms of poverty, the demographic groups most similar to Immigrants from Korea are Immigrants from Northern Europe (10.7%, a difference of 0.070%), Greek (10.7%, a difference of 0.090%), Danish (10.7%, a difference of 0.10%), Polish (10.7%, a difference of 0.19%), and Burmese (10.7%, a difference of 0.42%). Similarly, the demographic groups most similar to Iranians are Polish (10.7%, a difference of 0.090%), Danish (10.7%, a difference of 0.17%), Greek (10.7%, a difference of 0.18%), Immigrants from Northern Europe (10.7%, a difference of 0.34%), and Macedonian (10.8%, a difference of 0.54%).
| Demographics | Rating | Rank | Poverty |
| Immigrants | North Macedonia | 99.7 /100 | #20 | Exceptional 10.6% |
| Luxembourgers | 99.7 /100 | #21 | Exceptional 10.6% |
| Eastern Europeans | 99.7 /100 | #22 | Exceptional 10.6% |
| Swedes | 99.7 /100 | #23 | Exceptional 10.6% |
| Italians | 99.7 /100 | #24 | Exceptional 10.6% |
| Croatians | 99.6 /100 | #25 | Exceptional 10.6% |
| Burmese | 99.6 /100 | #26 | Exceptional 10.7% |
| Immigrants | Northern Europe | 99.6 /100 | #27 | Exceptional 10.7% |
| Immigrants | Korea | 99.5 /100 | #28 | Exceptional 10.7% |
| Greeks | 99.5 /100 | #29 | Exceptional 10.7% |
| Danes | 99.5 /100 | #30 | Exceptional 10.7% |
| Poles | 99.5 /100 | #31 | Exceptional 10.7% |
| Iranians | 99.5 /100 | #32 | Exceptional 10.7% |
| Macedonians | 99.4 /100 | #33 | Exceptional 10.8% |
| Immigrants | Poland | 99.4 /100 | #34 | Exceptional 10.8% |
| Tongans | 99.4 /100 | #35 | Exceptional 10.8% |
| Cypriots | 99.3 /100 | #36 | Exceptional 10.8% |
| Immigrants | Greece | 99.3 /100 | #37 | Exceptional 10.8% |
| Czechs | 99.3 /100 | #38 | Exceptional 10.8% |
| Immigrants | Pakistan | 99.3 /100 | #39 | Exceptional 10.8% |
| Russians | 99.3 /100 | #40 | Exceptional 10.9% |