Slovak vs Immigrants from Zimbabwe Poverty
COMPARE
Slovak
Immigrants from Zimbabwe
Poverty
Poverty Comparison
Slovaks
Immigrants from Zimbabwe
11.2%
POVERTY
97.4/ 100
METRIC RATING
68th/ 347
METRIC RANK
11.6%
POVERTY
92.1/ 100
METRIC RATING
106th/ 347
METRIC RANK
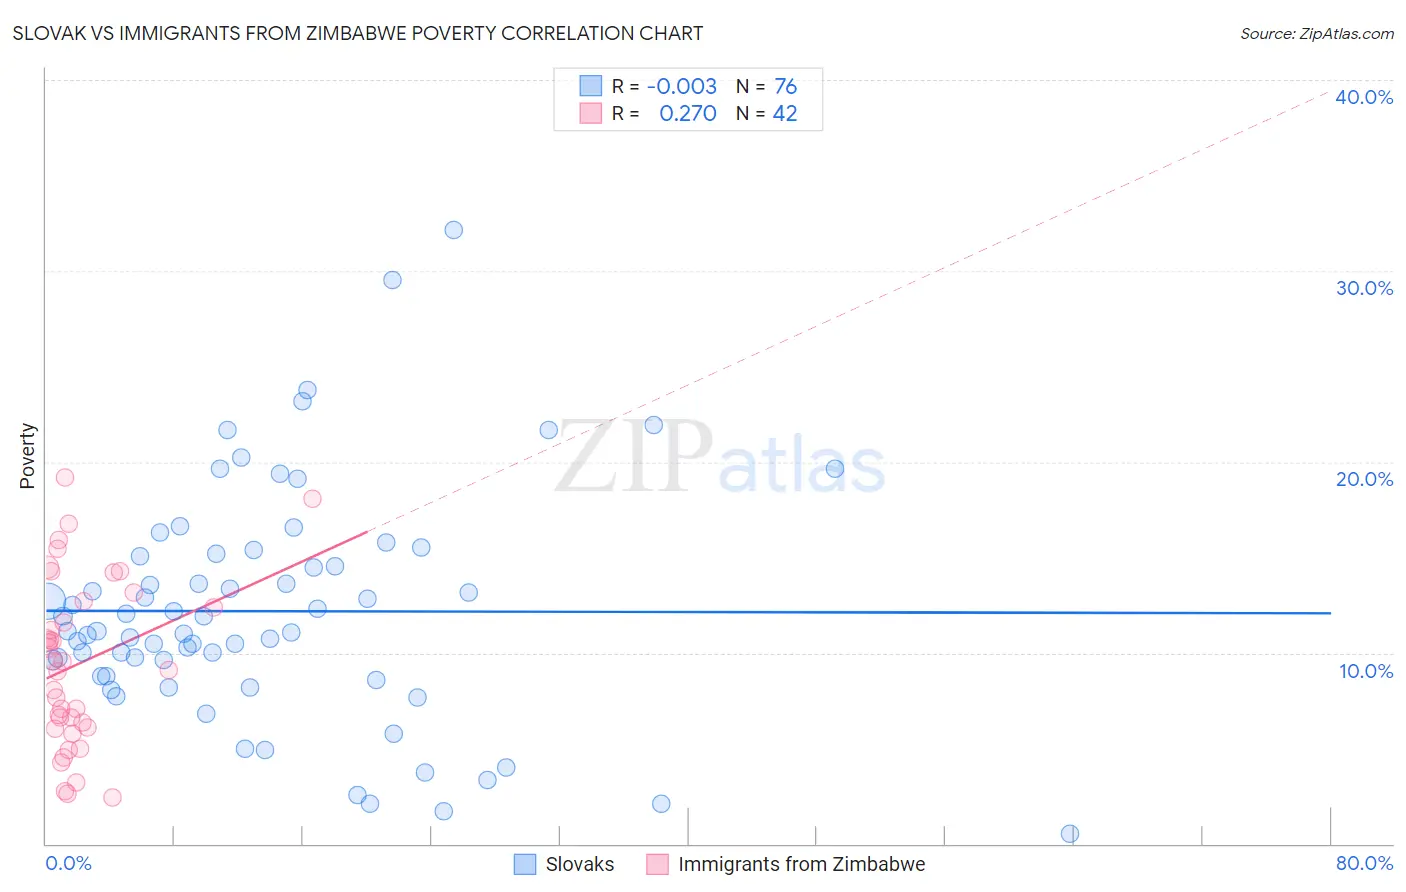
Slovak vs Immigrants from Zimbabwe Poverty Correlation Chart
The statistical analysis conducted on geographies consisting of 397,661,744 people shows no correlation between the proportion of Slovaks and poverty level in the United States with a correlation coefficient (R) of -0.003 and weighted average of 11.2%. Similarly, the statistical analysis conducted on geographies consisting of 117,789,316 people shows a weak positive correlation between the proportion of Immigrants from Zimbabwe and poverty level in the United States with a correlation coefficient (R) of 0.270 and weighted average of 11.6%, a difference of 3.1%.
Poverty Correlation Summary
| Measurement | Slovak | Immigrants from Zimbabwe |
| Minimum | 0.55% | 2.4% |
| Maximum | 32.2% | 19.2% |
| Range | 31.6% | 16.7% |
| Mean | 12.2% | 9.5% |
| Median | 11.1% | 9.3% |
| Interquartile 25% (IQ1) | 8.8% | 6.1% |
| Interquartile 75% (IQ3) | 15.1% | 12.7% |
| Interquartile Range (IQR) | 6.4% | 6.6% |
| Standard Deviation (Sample) | 6.1% | 4.4% |
| Standard Deviation (Population) | 6.0% | 4.4% |
Similar Demographics by Poverty
Demographics Similar to Slovaks by Poverty
In terms of poverty, the demographic groups most similar to Slovaks are Immigrants from Australia (11.2%, a difference of 0.020%), Immigrants from Netherlands (11.2%, a difference of 0.060%), Serbian (11.2%, a difference of 0.060%), Immigrants from Asia (11.2%, a difference of 0.13%), and Immigrants from Canada (11.3%, a difference of 0.15%).
| Demographics | Rating | Rank | Poverty |
| Immigrants | Italy | 97.9 /100 | #61 | Exceptional 11.2% |
| Austrians | 97.8 /100 | #62 | Exceptional 11.2% |
| Ukrainians | 97.8 /100 | #63 | Exceptional 11.2% |
| Swiss | 97.7 /100 | #64 | Exceptional 11.2% |
| Immigrants | Asia | 97.5 /100 | #65 | Exceptional 11.2% |
| Immigrants | Netherlands | 97.5 /100 | #66 | Exceptional 11.2% |
| Immigrants | Australia | 97.4 /100 | #67 | Exceptional 11.2% |
| Slovaks | 97.4 /100 | #68 | Exceptional 11.2% |
| Serbians | 97.4 /100 | #69 | Exceptional 11.2% |
| Immigrants | Canada | 97.3 /100 | #70 | Exceptional 11.3% |
| Zimbabweans | 97.3 /100 | #71 | Exceptional 11.3% |
| Europeans | 97.2 /100 | #72 | Exceptional 11.3% |
| Immigrants | Belgium | 97.2 /100 | #73 | Exceptional 11.3% |
| Carpatho Rusyns | 97.2 /100 | #74 | Exceptional 11.3% |
| Immigrants | Eastern Europe | 97.0 /100 | #75 | Exceptional 11.3% |
Demographics Similar to Immigrants from Zimbabwe by Poverty
In terms of poverty, the demographic groups most similar to Immigrants from Zimbabwe are Portuguese (11.6%, a difference of 0.0%), Native Hawaiian (11.6%, a difference of 0.020%), Palestinian (11.6%, a difference of 0.090%), Canadian (11.6%, a difference of 0.12%), and Laotian (11.6%, a difference of 0.13%).
| Demographics | Rating | Rank | Poverty |
| Immigrants | Indonesia | 94.2 /100 | #99 | Exceptional 11.5% |
| Scottish | 94.0 /100 | #100 | Exceptional 11.5% |
| Slavs | 93.3 /100 | #101 | Exceptional 11.5% |
| Laotians | 92.4 /100 | #102 | Exceptional 11.6% |
| Okinawans | 92.4 /100 | #103 | Exceptional 11.6% |
| Native Hawaiians | 92.1 /100 | #104 | Exceptional 11.6% |
| Portuguese | 92.1 /100 | #105 | Exceptional 11.6% |
| Immigrants | Zimbabwe | 92.1 /100 | #106 | Exceptional 11.6% |
| Palestinians | 91.8 /100 | #107 | Exceptional 11.6% |
| Canadians | 91.7 /100 | #108 | Exceptional 11.6% |
| Immigrants | Turkey | 91.7 /100 | #109 | Exceptional 11.6% |
| Welsh | 91.6 /100 | #110 | Exceptional 11.6% |
| French Canadians | 91.0 /100 | #111 | Exceptional 11.6% |
| Immigrants | Southern Europe | 90.8 /100 | #112 | Exceptional 11.6% |
| Immigrants | Belarus | 90.8 /100 | #113 | Exceptional 11.6% |