Immigrants from Burma/Myanmar vs Pakistani Child Poverty Among Girls Under 16
COMPARE
Immigrants from Burma/Myanmar
Pakistani
Child Poverty Among Girls Under 16
Child Poverty Among Girls Under 16 Comparison
Immigrants from Burma/Myanmar
Pakistanis
19.7%
CHILD POVERTY AMONG GIRLS UNDER 16
0.1/ 100
METRIC RATING
263rd/ 347
METRIC RANK
15.3%
CHILD POVERTY AMONG GIRLS UNDER 16
92.3/ 100
METRIC RATING
120th/ 347
METRIC RANK
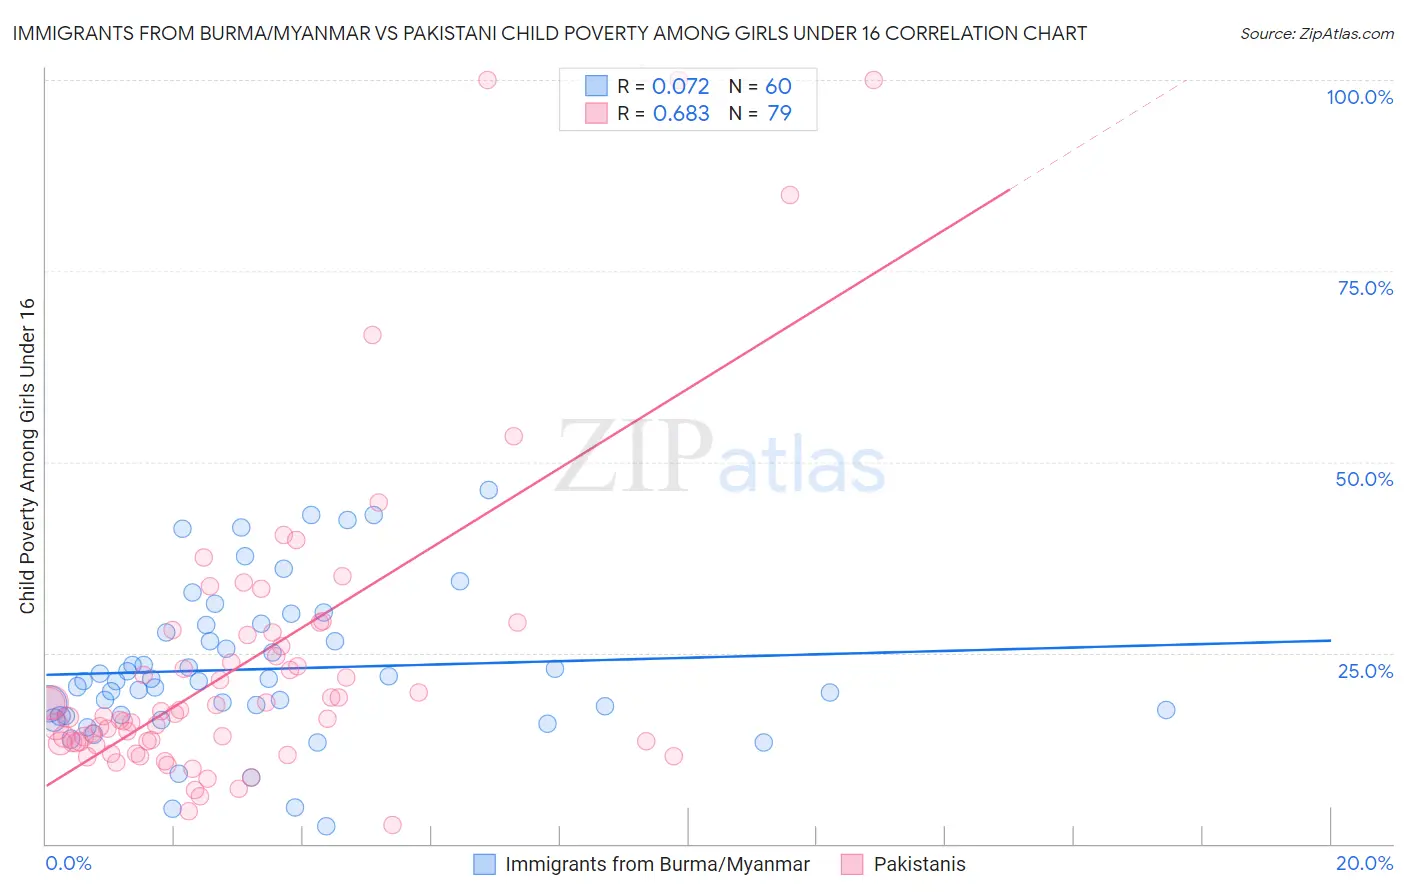
Immigrants from Burma/Myanmar vs Pakistani Child Poverty Among Girls Under 16 Correlation Chart
The statistical analysis conducted on geographies consisting of 171,314,944 people shows a slight positive correlation between the proportion of Immigrants from Burma/Myanmar and poverty level among girls under the age of 16 in the United States with a correlation coefficient (R) of 0.072 and weighted average of 19.7%. Similarly, the statistical analysis conducted on geographies consisting of 331,174,379 people shows a significant positive correlation between the proportion of Pakistanis and poverty level among girls under the age of 16 in the United States with a correlation coefficient (R) of 0.683 and weighted average of 15.3%, a difference of 28.5%.
Child Poverty Among Girls Under 16 Correlation Summary
| Measurement | Immigrants from Burma/Myanmar | Pakistani |
| Minimum | 2.4% | 2.5% |
| Maximum | 46.4% | 100.0% |
| Range | 44.0% | 97.5% |
| Mean | 22.9% | 23.5% |
| Median | 21.3% | 16.7% |
| Interquartile 25% (IQ1) | 16.8% | 13.2% |
| Interquartile 75% (IQ3) | 28.2% | 27.3% |
| Interquartile Range (IQR) | 11.3% | 14.1% |
| Standard Deviation (Sample) | 9.8% | 20.1% |
| Standard Deviation (Population) | 9.7% | 20.0% |
Similar Demographics by Child Poverty Among Girls Under 16
Demographics Similar to Immigrants from Burma/Myanmar by Child Poverty Among Girls Under 16
In terms of child poverty among girls under 16, the demographic groups most similar to Immigrants from Burma/Myanmar are Jamaican (19.7%, a difference of 0.11%), Chickasaw (19.6%, a difference of 0.12%), Immigrants from Jamaica (19.8%, a difference of 0.55%), Vietnamese (19.5%, a difference of 0.64%), and Mexican American Indian (19.5%, a difference of 0.73%).
| Demographics | Rating | Rank | Child Poverty Among Girls Under 16 |
| Trinidadians and Tobagonians | 0.2 /100 | #256 | Tragic 19.3% |
| Guyanese | 0.2 /100 | #257 | Tragic 19.4% |
| Salvadorans | 0.2 /100 | #258 | Tragic 19.4% |
| Ottawa | 0.2 /100 | #259 | Tragic 19.4% |
| Mexican American Indians | 0.2 /100 | #260 | Tragic 19.5% |
| Vietnamese | 0.2 /100 | #261 | Tragic 19.5% |
| Chickasaw | 0.1 /100 | #262 | Tragic 19.6% |
| Immigrants | Burma/Myanmar | 0.1 /100 | #263 | Tragic 19.7% |
| Jamaicans | 0.1 /100 | #264 | Tragic 19.7% |
| Immigrants | Jamaica | 0.1 /100 | #265 | Tragic 19.8% |
| Spanish Americans | 0.1 /100 | #266 | Tragic 19.8% |
| Immigrants | Bangladesh | 0.1 /100 | #267 | Tragic 19.9% |
| Spanish American Indians | 0.1 /100 | #268 | Tragic 19.9% |
| Liberians | 0.1 /100 | #269 | Tragic 19.9% |
| Cherokee | 0.1 /100 | #270 | Tragic 19.9% |
Demographics Similar to Pakistanis by Child Poverty Among Girls Under 16
In terms of child poverty among girls under 16, the demographic groups most similar to Pakistanis are English (15.3%, a difference of 0.020%), Immigrants from Zimbabwe (15.3%, a difference of 0.090%), Immigrants from Southern Europe (15.3%, a difference of 0.20%), Portuguese (15.3%, a difference of 0.21%), and Irish (15.3%, a difference of 0.31%).
| Demographics | Rating | Rank | Child Poverty Among Girls Under 16 |
| Dutch | 94.3 /100 | #113 | Exceptional 15.1% |
| Sri Lankans | 94.0 /100 | #114 | Exceptional 15.2% |
| Belgians | 93.9 /100 | #115 | Exceptional 15.2% |
| Immigrants | Denmark | 93.3 /100 | #116 | Exceptional 15.2% |
| Immigrants | North Macedonia | 93.1 /100 | #117 | Exceptional 15.2% |
| Immigrants | Southern Europe | 92.7 /100 | #118 | Exceptional 15.3% |
| Immigrants | Zimbabwe | 92.5 /100 | #119 | Exceptional 15.3% |
| Pakistanis | 92.3 /100 | #120 | Exceptional 15.3% |
| English | 92.2 /100 | #121 | Exceptional 15.3% |
| Portuguese | 91.8 /100 | #122 | Exceptional 15.3% |
| Irish | 91.5 /100 | #123 | Exceptional 15.3% |
| Carpatho Rusyns | 91.4 /100 | #124 | Exceptional 15.3% |
| Peruvians | 91.2 /100 | #125 | Exceptional 15.4% |
| Scottish | 91.0 /100 | #126 | Exceptional 15.4% |
| Immigrants | Norway | 90.8 /100 | #127 | Exceptional 15.4% |