Immigrants from Burma/Myanmar vs Indian (Asian) Child Poverty Among Girls Under 16
COMPARE
Immigrants from Burma/Myanmar
Indian (Asian)
Child Poverty Among Girls Under 16
Child Poverty Among Girls Under 16 Comparison
Immigrants from Burma/Myanmar
Indians (Asian)
19.7%
CHILD POVERTY AMONG GIRLS UNDER 16
0.1/ 100
METRIC RATING
263rd/ 347
METRIC RANK
13.3%
CHILD POVERTY AMONG GIRLS UNDER 16
99.9/ 100
METRIC RATING
22nd/ 347
METRIC RANK
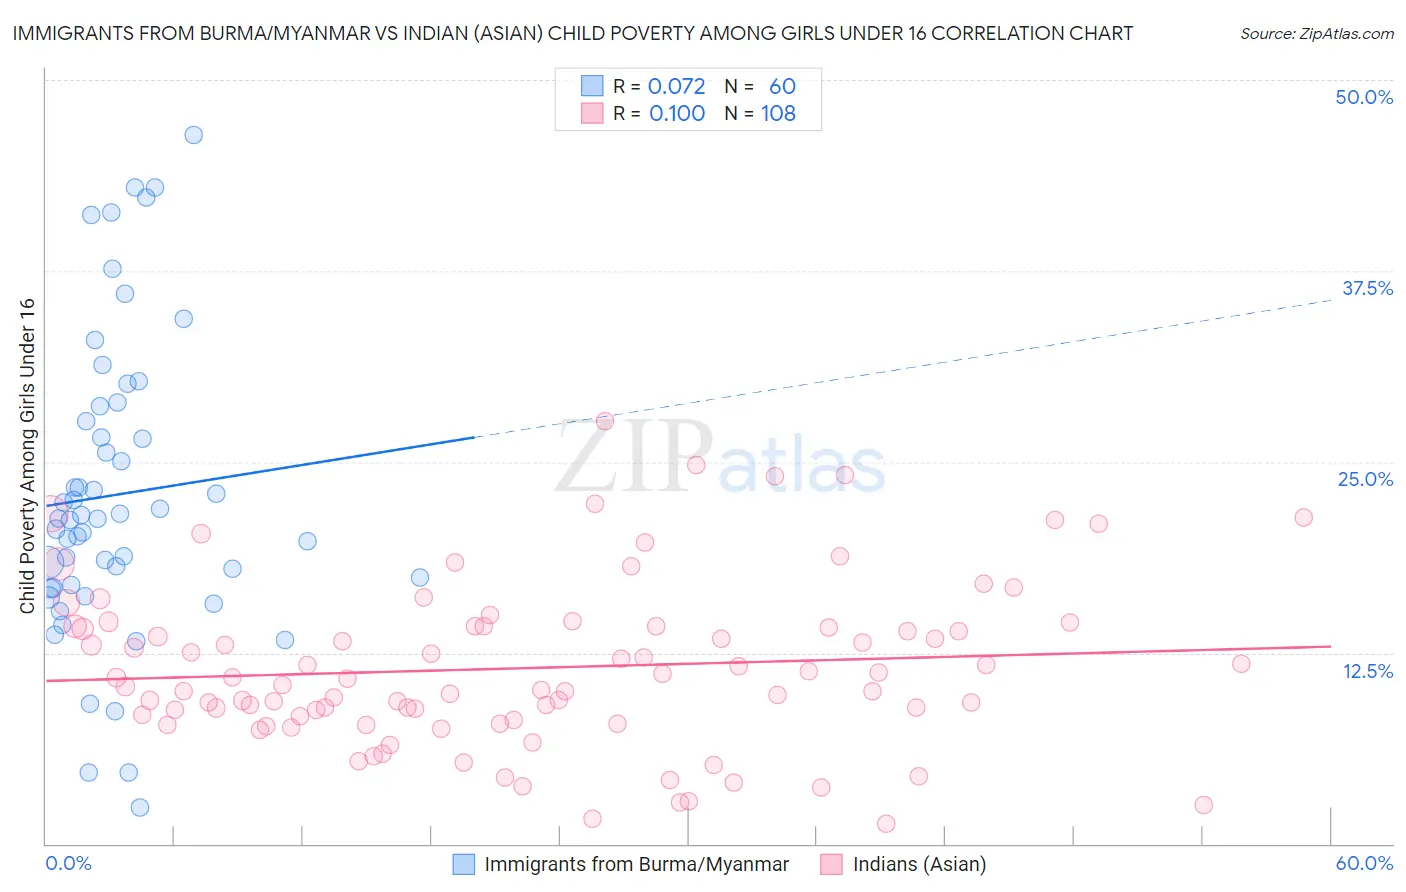
Immigrants from Burma/Myanmar vs Indian (Asian) Child Poverty Among Girls Under 16 Correlation Chart
The statistical analysis conducted on geographies consisting of 171,314,944 people shows a slight positive correlation between the proportion of Immigrants from Burma/Myanmar and poverty level among girls under the age of 16 in the United States with a correlation coefficient (R) of 0.072 and weighted average of 19.7%. Similarly, the statistical analysis conducted on geographies consisting of 481,525,244 people shows a slight positive correlation between the proportion of Indians (Asian) and poverty level among girls under the age of 16 in the United States with a correlation coefficient (R) of 0.100 and weighted average of 13.3%, a difference of 47.5%.
Child Poverty Among Girls Under 16 Correlation Summary
| Measurement | Immigrants from Burma/Myanmar | Indian (Asian) |
| Minimum | 2.4% | 1.3% |
| Maximum | 46.4% | 27.7% |
| Range | 44.0% | 26.3% |
| Mean | 22.9% | 11.5% |
| Median | 21.3% | 10.6% |
| Interquartile 25% (IQ1) | 16.8% | 8.3% |
| Interquartile 75% (IQ3) | 28.2% | 14.2% |
| Interquartile Range (IQR) | 11.3% | 6.0% |
| Standard Deviation (Sample) | 9.8% | 5.4% |
| Standard Deviation (Population) | 9.7% | 5.3% |
Similar Demographics by Child Poverty Among Girls Under 16
Demographics Similar to Immigrants from Burma/Myanmar by Child Poverty Among Girls Under 16
In terms of child poverty among girls under 16, the demographic groups most similar to Immigrants from Burma/Myanmar are Jamaican (19.7%, a difference of 0.11%), Chickasaw (19.6%, a difference of 0.12%), Immigrants from Jamaica (19.8%, a difference of 0.55%), Vietnamese (19.5%, a difference of 0.64%), and Mexican American Indian (19.5%, a difference of 0.73%).
| Demographics | Rating | Rank | Child Poverty Among Girls Under 16 |
| Trinidadians and Tobagonians | 0.2 /100 | #256 | Tragic 19.3% |
| Guyanese | 0.2 /100 | #257 | Tragic 19.4% |
| Salvadorans | 0.2 /100 | #258 | Tragic 19.4% |
| Ottawa | 0.2 /100 | #259 | Tragic 19.4% |
| Mexican American Indians | 0.2 /100 | #260 | Tragic 19.5% |
| Vietnamese | 0.2 /100 | #261 | Tragic 19.5% |
| Chickasaw | 0.1 /100 | #262 | Tragic 19.6% |
| Immigrants | Burma/Myanmar | 0.1 /100 | #263 | Tragic 19.7% |
| Jamaicans | 0.1 /100 | #264 | Tragic 19.7% |
| Immigrants | Jamaica | 0.1 /100 | #265 | Tragic 19.8% |
| Spanish Americans | 0.1 /100 | #266 | Tragic 19.8% |
| Immigrants | Bangladesh | 0.1 /100 | #267 | Tragic 19.9% |
| Spanish American Indians | 0.1 /100 | #268 | Tragic 19.9% |
| Liberians | 0.1 /100 | #269 | Tragic 19.9% |
| Cherokee | 0.1 /100 | #270 | Tragic 19.9% |
Demographics Similar to Indians (Asian) by Child Poverty Among Girls Under 16
In terms of child poverty among girls under 16, the demographic groups most similar to Indians (Asian) are Norwegian (13.3%, a difference of 0.17%), Assyrian/Chaldean/Syriac (13.3%, a difference of 0.20%), Immigrants from Eastern Asia (13.4%, a difference of 0.26%), Immigrants from Japan (13.3%, a difference of 0.32%), and Immigrants from China (13.4%, a difference of 0.72%).
| Demographics | Rating | Rank | Child Poverty Among Girls Under 16 |
| Okinawans | 99.9 /100 | #15 | Exceptional 13.0% |
| Immigrants | Lithuania | 99.9 /100 | #16 | Exceptional 13.1% |
| Bulgarians | 99.9 /100 | #17 | Exceptional 13.1% |
| Immigrants | Korea | 99.9 /100 | #18 | Exceptional 13.1% |
| Cypriots | 99.9 /100 | #19 | Exceptional 13.2% |
| Immigrants | Japan | 99.9 /100 | #20 | Exceptional 13.3% |
| Assyrians/Chaldeans/Syriacs | 99.9 /100 | #21 | Exceptional 13.3% |
| Indians (Asian) | 99.9 /100 | #22 | Exceptional 13.3% |
| Norwegians | 99.9 /100 | #23 | Exceptional 13.3% |
| Immigrants | Eastern Asia | 99.9 /100 | #24 | Exceptional 13.4% |
| Immigrants | China | 99.8 /100 | #25 | Exceptional 13.4% |
| Eastern Europeans | 99.8 /100 | #26 | Exceptional 13.5% |
| Latvians | 99.8 /100 | #27 | Exceptional 13.5% |
| Tongans | 99.8 /100 | #28 | Exceptional 13.6% |
| Bolivians | 99.8 /100 | #29 | Exceptional 13.6% |