Immigrants from Burma/Myanmar vs Yuman Child Poverty Among Girls Under 16
COMPARE
Immigrants from Burma/Myanmar
Yuman
Child Poverty Among Girls Under 16
Child Poverty Among Girls Under 16 Comparison
Immigrants from Burma/Myanmar
Yuman
19.7%
CHILD POVERTY AMONG GIRLS UNDER 16
0.1/ 100
METRIC RATING
263rd/ 347
METRIC RANK
27.1%
CHILD POVERTY AMONG GIRLS UNDER 16
0.0/ 100
METRIC RATING
340th/ 347
METRIC RANK
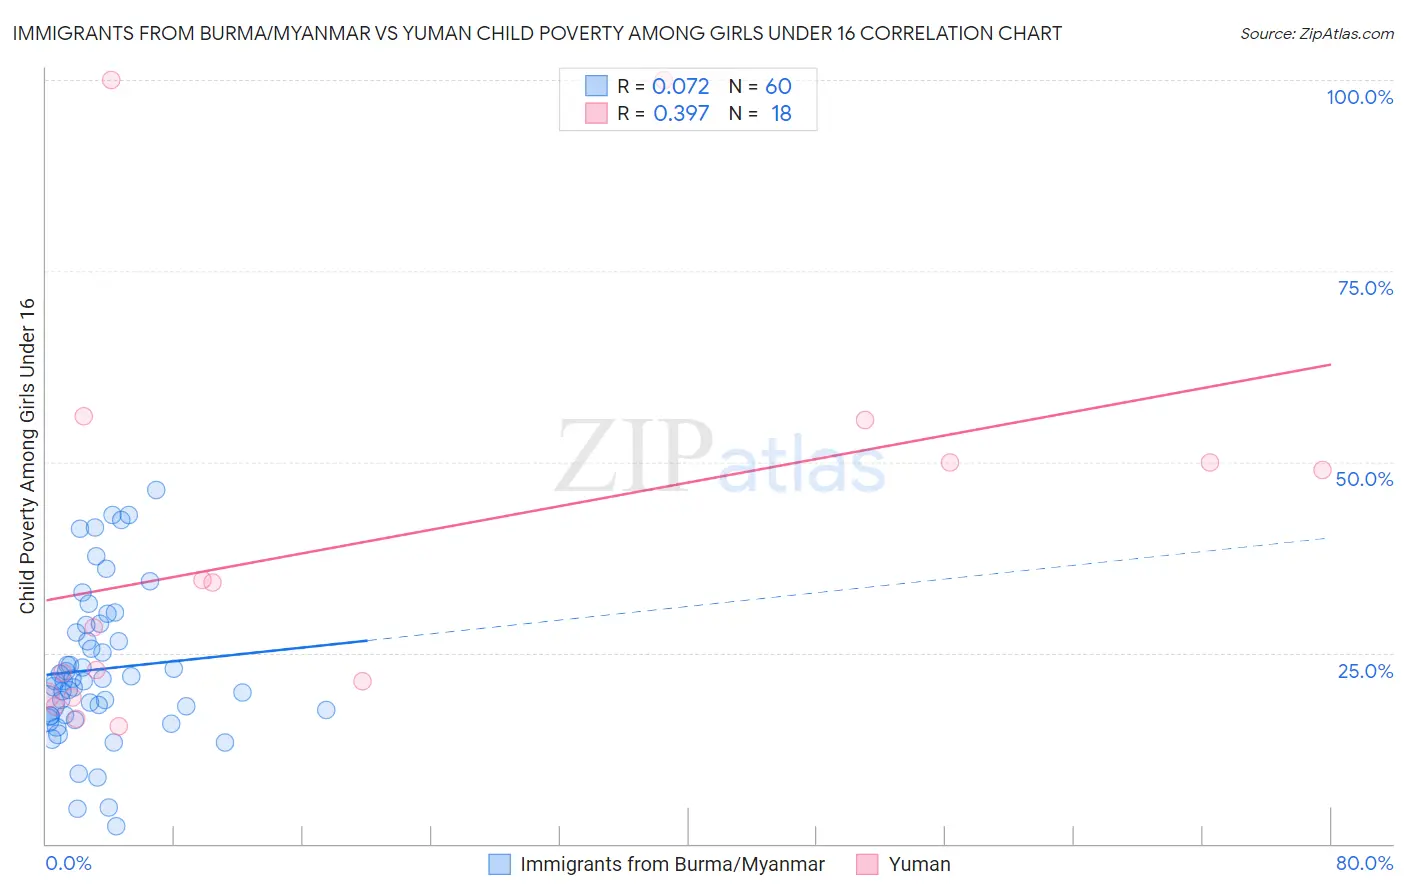
Immigrants from Burma/Myanmar vs Yuman Child Poverty Among Girls Under 16 Correlation Chart
The statistical analysis conducted on geographies consisting of 171,314,944 people shows a slight positive correlation between the proportion of Immigrants from Burma/Myanmar and poverty level among girls under the age of 16 in the United States with a correlation coefficient (R) of 0.072 and weighted average of 19.7%. Similarly, the statistical analysis conducted on geographies consisting of 40,600,954 people shows a mild positive correlation between the proportion of Yuman and poverty level among girls under the age of 16 in the United States with a correlation coefficient (R) of 0.397 and weighted average of 27.1%, a difference of 37.8%.
Child Poverty Among Girls Under 16 Correlation Summary
| Measurement | Immigrants from Burma/Myanmar | Yuman |
| Minimum | 2.4% | 15.3% |
| Maximum | 46.4% | 100.0% |
| Range | 44.0% | 84.7% |
| Mean | 22.9% | 39.6% |
| Median | 21.3% | 31.3% |
| Interquartile 25% (IQ1) | 16.8% | 19.5% |
| Interquartile 75% (IQ3) | 28.2% | 50.0% |
| Interquartile Range (IQR) | 11.3% | 30.5% |
| Standard Deviation (Sample) | 9.8% | 26.2% |
| Standard Deviation (Population) | 9.7% | 25.4% |
Similar Demographics by Child Poverty Among Girls Under 16
Demographics Similar to Immigrants from Burma/Myanmar by Child Poverty Among Girls Under 16
In terms of child poverty among girls under 16, the demographic groups most similar to Immigrants from Burma/Myanmar are Jamaican (19.7%, a difference of 0.11%), Chickasaw (19.6%, a difference of 0.12%), Immigrants from Jamaica (19.8%, a difference of 0.55%), Vietnamese (19.5%, a difference of 0.64%), and Mexican American Indian (19.5%, a difference of 0.73%).
| Demographics | Rating | Rank | Child Poverty Among Girls Under 16 |
| Trinidadians and Tobagonians | 0.2 /100 | #256 | Tragic 19.3% |
| Guyanese | 0.2 /100 | #257 | Tragic 19.4% |
| Salvadorans | 0.2 /100 | #258 | Tragic 19.4% |
| Ottawa | 0.2 /100 | #259 | Tragic 19.4% |
| Mexican American Indians | 0.2 /100 | #260 | Tragic 19.5% |
| Vietnamese | 0.2 /100 | #261 | Tragic 19.5% |
| Chickasaw | 0.1 /100 | #262 | Tragic 19.6% |
| Immigrants | Burma/Myanmar | 0.1 /100 | #263 | Tragic 19.7% |
| Jamaicans | 0.1 /100 | #264 | Tragic 19.7% |
| Immigrants | Jamaica | 0.1 /100 | #265 | Tragic 19.8% |
| Spanish Americans | 0.1 /100 | #266 | Tragic 19.8% |
| Immigrants | Bangladesh | 0.1 /100 | #267 | Tragic 19.9% |
| Spanish American Indians | 0.1 /100 | #268 | Tragic 19.9% |
| Liberians | 0.1 /100 | #269 | Tragic 19.9% |
| Cherokee | 0.1 /100 | #270 | Tragic 19.9% |
Demographics Similar to Yuman by Child Poverty Among Girls Under 16
In terms of child poverty among girls under 16, the demographic groups most similar to Yuman are Crow (26.4%, a difference of 2.7%), Hopi (27.9%, a difference of 2.9%), Cheyenne (26.3%, a difference of 3.1%), Pima (28.2%, a difference of 4.2%), and Yup'ik (25.8%, a difference of 4.9%).
| Demographics | Rating | Rank | Child Poverty Among Girls Under 16 |
| Blacks/African Americans | 0.0 /100 | #333 | Tragic 24.7% |
| Menominee | 0.0 /100 | #334 | Tragic 25.0% |
| Pueblo | 0.0 /100 | #335 | Tragic 25.2% |
| Sioux | 0.0 /100 | #336 | Tragic 25.6% |
| Yup'ik | 0.0 /100 | #337 | Tragic 25.8% |
| Cheyenne | 0.0 /100 | #338 | Tragic 26.3% |
| Crow | 0.0 /100 | #339 | Tragic 26.4% |
| Yuman | 0.0 /100 | #340 | Tragic 27.1% |
| Hopi | 0.0 /100 | #341 | Tragic 27.9% |
| Pima | 0.0 /100 | #342 | Tragic 28.2% |
| Immigrants | Yemen | 0.0 /100 | #343 | Tragic 29.5% |
| Navajo | 0.0 /100 | #344 | Tragic 30.5% |
| Lumbee | 0.0 /100 | #345 | Tragic 30.7% |
| Tohono O'odham | 0.0 /100 | #346 | Tragic 31.6% |
| Puerto Ricans | 0.0 /100 | #347 | Tragic 32.7% |