Immigrants from Burma/Myanmar vs West Indian Child Poverty Among Girls Under 16
COMPARE
Immigrants from Burma/Myanmar
West Indian
Child Poverty Among Girls Under 16
Child Poverty Among Girls Under 16 Comparison
Immigrants from Burma/Myanmar
West Indians
19.7%
CHILD POVERTY AMONG GIRLS UNDER 16
0.1/ 100
METRIC RATING
263rd/ 347
METRIC RANK
20.3%
CHILD POVERTY AMONG GIRLS UNDER 16
0.0/ 100
METRIC RATING
282nd/ 347
METRIC RANK
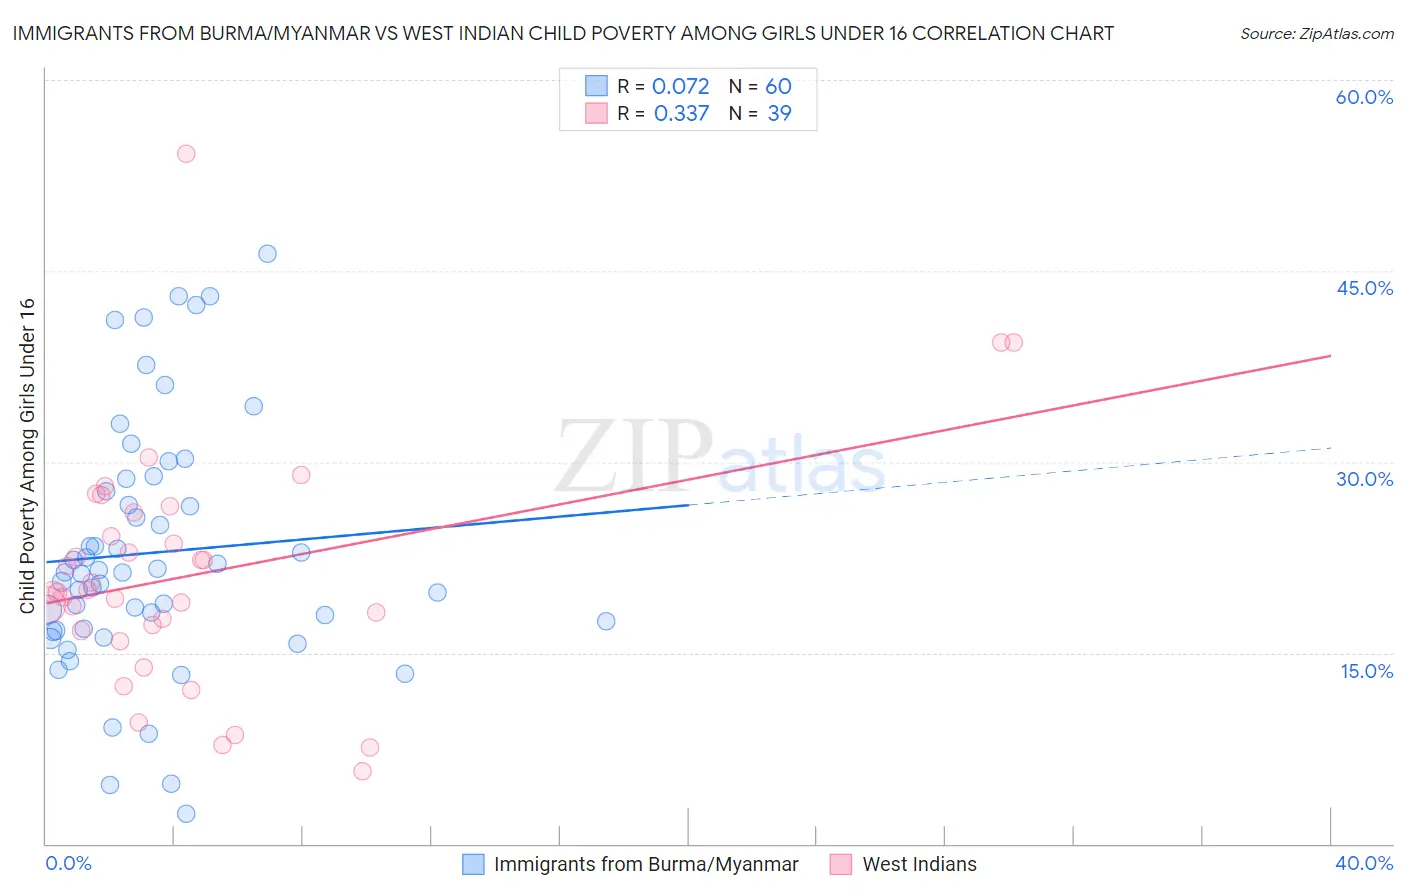
Immigrants from Burma/Myanmar vs West Indian Child Poverty Among Girls Under 16 Correlation Chart
The statistical analysis conducted on geographies consisting of 171,314,944 people shows a slight positive correlation between the proportion of Immigrants from Burma/Myanmar and poverty level among girls under the age of 16 in the United States with a correlation coefficient (R) of 0.072 and weighted average of 19.7%. Similarly, the statistical analysis conducted on geographies consisting of 251,644,082 people shows a mild positive correlation between the proportion of West Indians and poverty level among girls under the age of 16 in the United States with a correlation coefficient (R) of 0.337 and weighted average of 20.3%, a difference of 3.3%.
Child Poverty Among Girls Under 16 Correlation Summary
| Measurement | Immigrants from Burma/Myanmar | West Indian |
| Minimum | 2.4% | 5.7% |
| Maximum | 46.4% | 54.2% |
| Range | 44.0% | 48.5% |
| Mean | 22.9% | 21.2% |
| Median | 21.3% | 19.8% |
| Interquartile 25% (IQ1) | 16.8% | 16.7% |
| Interquartile 75% (IQ3) | 28.2% | 26.0% |
| Interquartile Range (IQR) | 11.3% | 9.3% |
| Standard Deviation (Sample) | 9.8% | 9.4% |
| Standard Deviation (Population) | 9.7% | 9.2% |
Demographics Similar to Immigrants from Burma/Myanmar and West Indians by Child Poverty Among Girls Under 16
In terms of child poverty among girls under 16, the demographic groups most similar to Immigrants from Burma/Myanmar are Jamaican (19.7%, a difference of 0.11%), Chickasaw (19.6%, a difference of 0.12%), Immigrants from Jamaica (19.8%, a difference of 0.55%), Spanish American (19.8%, a difference of 0.79%), and Immigrants from Bangladesh (19.9%, a difference of 1.0%). Similarly, the demographic groups most similar to West Indians are Central American (20.2%, a difference of 0.28%), Immigrants from Liberia (20.2%, a difference of 0.35%), Immigrants from Zaire (20.2%, a difference of 0.36%), Barbadian (20.2%, a difference of 0.49%), and Belizean (20.2%, a difference of 0.52%).
| Demographics | Rating | Rank | Child Poverty Among Girls Under 16 |
| Chickasaw | 0.1 /100 | #262 | Tragic 19.6% |
| Immigrants | Burma/Myanmar | 0.1 /100 | #263 | Tragic 19.7% |
| Jamaicans | 0.1 /100 | #264 | Tragic 19.7% |
| Immigrants | Jamaica | 0.1 /100 | #265 | Tragic 19.8% |
| Spanish Americans | 0.1 /100 | #266 | Tragic 19.8% |
| Immigrants | Bangladesh | 0.1 /100 | #267 | Tragic 19.9% |
| Spanish American Indians | 0.1 /100 | #268 | Tragic 19.9% |
| Liberians | 0.1 /100 | #269 | Tragic 19.9% |
| Cherokee | 0.1 /100 | #270 | Tragic 19.9% |
| Immigrants | Barbados | 0.1 /100 | #271 | Tragic 19.9% |
| Immigrants | El Salvador | 0.1 /100 | #272 | Tragic 20.0% |
| Bangladeshis | 0.1 /100 | #273 | Tragic 20.0% |
| Immigrants | St. Vincent and the Grenadines | 0.0 /100 | #274 | Tragic 20.1% |
| Sub-Saharan Africans | 0.0 /100 | #275 | Tragic 20.1% |
| Comanche | 0.0 /100 | #276 | Tragic 20.2% |
| Belizeans | 0.0 /100 | #277 | Tragic 20.2% |
| Barbadians | 0.0 /100 | #278 | Tragic 20.2% |
| Immigrants | Zaire | 0.0 /100 | #279 | Tragic 20.2% |
| Immigrants | Liberia | 0.0 /100 | #280 | Tragic 20.2% |
| Central Americans | 0.0 /100 | #281 | Tragic 20.2% |
| West Indians | 0.0 /100 | #282 | Tragic 20.3% |