Immigrants from Burma/Myanmar vs Pakistani Unemployment Among Ages 45 to 54 years
COMPARE
Immigrants from Burma/Myanmar
Pakistani
Unemployment Among Ages 45 to 54 years
Unemployment Among Ages 45 to 54 years Comparison
Immigrants from Burma/Myanmar
Pakistanis
4.4%
UNEMPLOYMENT AMONG AGES 45 TO 54 YEARS
94.9/ 100
METRIC RATING
99th/ 347
METRIC RANK
4.4%
UNEMPLOYMENT AMONG AGES 45 TO 54 YEARS
90.7/ 100
METRIC RATING
115th/ 347
METRIC RANK
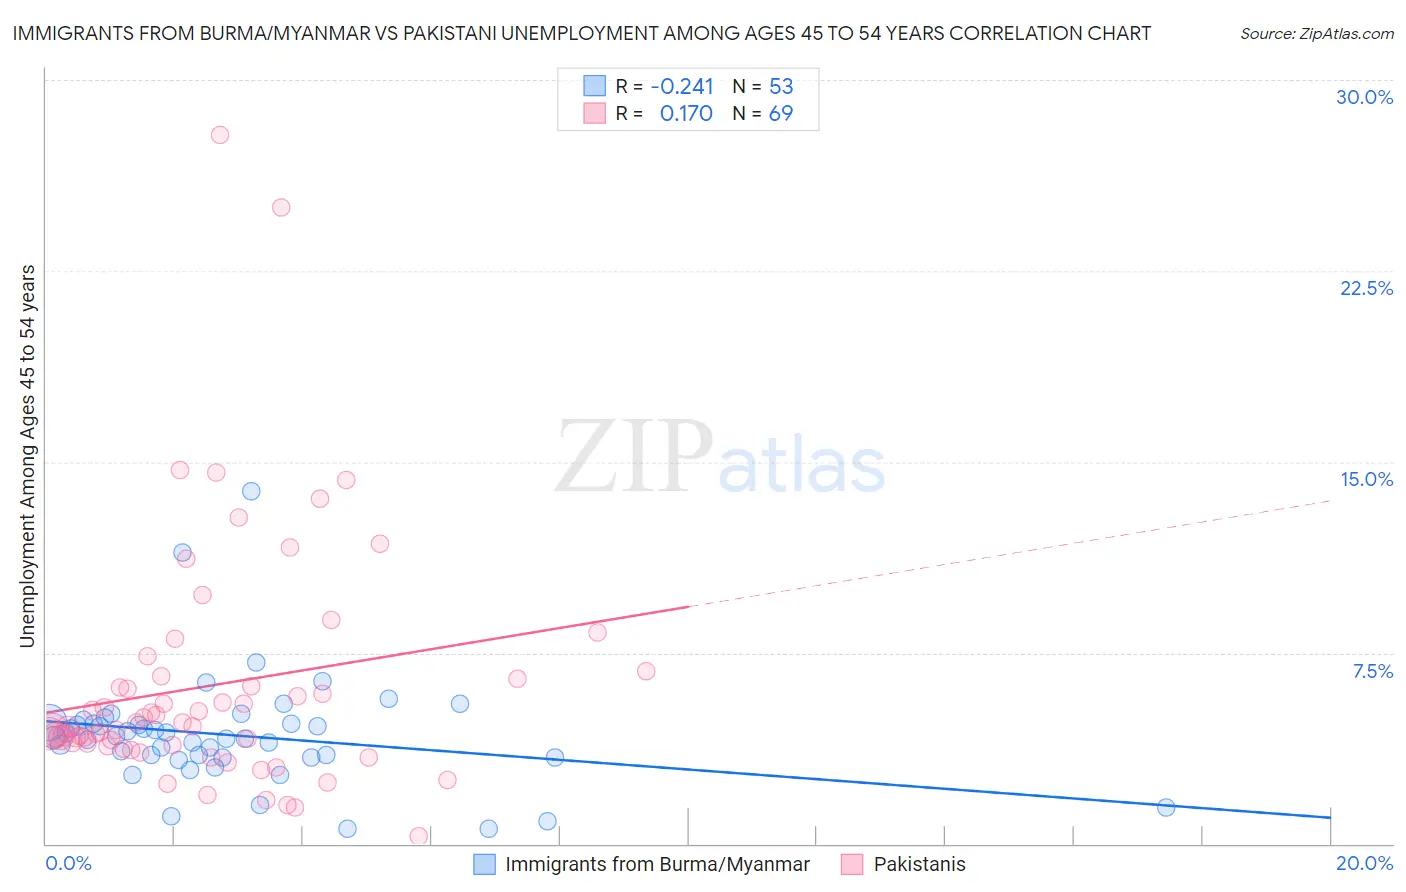
Immigrants from Burma/Myanmar vs Pakistani Unemployment Among Ages 45 to 54 years Correlation Chart
The statistical analysis conducted on geographies consisting of 170,673,740 people shows a weak negative correlation between the proportion of Immigrants from Burma/Myanmar and unemployment rate among population between the ages 45 and 54 in the United States with a correlation coefficient (R) of -0.241 and weighted average of 4.4%. Similarly, the statistical analysis conducted on geographies consisting of 329,355,930 people shows a poor positive correlation between the proportion of Pakistanis and unemployment rate among population between the ages 45 and 54 in the United States with a correlation coefficient (R) of 0.170 and weighted average of 4.4%, a difference of 0.77%.
Unemployment Among Ages 45 to 54 years Correlation Summary
| Measurement | Immigrants from Burma/Myanmar | Pakistani |
| Minimum | 0.60% | 0.30% |
| Maximum | 13.8% | 27.9% |
| Range | 13.2% | 27.6% |
| Mean | 4.3% | 6.2% |
| Median | 4.2% | 4.6% |
| Interquartile 25% (IQ1) | 3.4% | 3.9% |
| Interquartile 75% (IQ3) | 4.7% | 6.5% |
| Interquartile Range (IQR) | 1.3% | 2.7% |
| Standard Deviation (Sample) | 2.2% | 4.8% |
| Standard Deviation (Population) | 2.2% | 4.8% |
Demographics Similar to Immigrants from Burma/Myanmar and Pakistanis by Unemployment Among Ages 45 to 54 years
In terms of unemployment among ages 45 to 54 years, the demographic groups most similar to Immigrants from Burma/Myanmar are Immigrants from Canada (4.4%, a difference of 0.020%), Romanian (4.4%, a difference of 0.020%), Immigrants from Eritrea (4.4%, a difference of 0.030%), Immigrants from North America (4.4%, a difference of 0.22%), and Sri Lankan (4.4%, a difference of 0.27%). Similarly, the demographic groups most similar to Pakistanis are Immigrants from Chile (4.4%, a difference of 0.020%), Immigrants from North Macedonia (4.4%, a difference of 0.020%), French Canadian (4.4%, a difference of 0.040%), South African (4.4%, a difference of 0.040%), and Immigrants from Saudi Arabia (4.4%, a difference of 0.050%).
| Demographics | Rating | Rank | Unemployment Among Ages 45 to 54 years |
| Immigrants | Canada | 95.0 /100 | #97 | Exceptional 4.4% |
| Romanians | 94.9 /100 | #98 | Exceptional 4.4% |
| Immigrants | Burma/Myanmar | 94.9 /100 | #99 | Exceptional 4.4% |
| Immigrants | Eritrea | 94.7 /100 | #100 | Exceptional 4.4% |
| Immigrants | North America | 93.9 /100 | #101 | Exceptional 4.4% |
| Sri Lankans | 93.7 /100 | #102 | Exceptional 4.4% |
| Icelanders | 93.5 /100 | #103 | Exceptional 4.4% |
| Immigrants | Sweden | 93.0 /100 | #104 | Exceptional 4.4% |
| Immigrants | Kenya | 92.8 /100 | #105 | Exceptional 4.4% |
| Iranians | 92.5 /100 | #106 | Exceptional 4.4% |
| Immigrants | South Africa | 92.5 /100 | #107 | Exceptional 4.4% |
| Russians | 92.1 /100 | #108 | Exceptional 4.4% |
| New Zealanders | 91.9 /100 | #109 | Exceptional 4.4% |
| Immigrants | England | 91.3 /100 | #110 | Exceptional 4.4% |
| Immigrants | Nicaragua | 91.3 /100 | #111 | Exceptional 4.4% |
| Immigrants | Saudi Arabia | 91.1 /100 | #112 | Exceptional 4.4% |
| French Canadians | 91.0 /100 | #113 | Exceptional 4.4% |
| Immigrants | Chile | 90.9 /100 | #114 | Exceptional 4.4% |
| Pakistanis | 90.7 /100 | #115 | Exceptional 4.4% |
| Immigrants | North Macedonia | 90.6 /100 | #116 | Exceptional 4.4% |
| South Africans | 90.4 /100 | #117 | Exceptional 4.4% |