Assyrian/Chaldean/Syriac vs Pakistani Child Poverty Among Girls Under 16
COMPARE
Assyrian/Chaldean/Syriac
Pakistani
Child Poverty Among Girls Under 16
Child Poverty Among Girls Under 16 Comparison
Assyrians/Chaldeans/Syriacs
Pakistanis
13.3%
CHILD POVERTY AMONG GIRLS UNDER 16
99.9/ 100
METRIC RATING
21st/ 347
METRIC RANK
15.3%
CHILD POVERTY AMONG GIRLS UNDER 16
92.3/ 100
METRIC RATING
120th/ 347
METRIC RANK
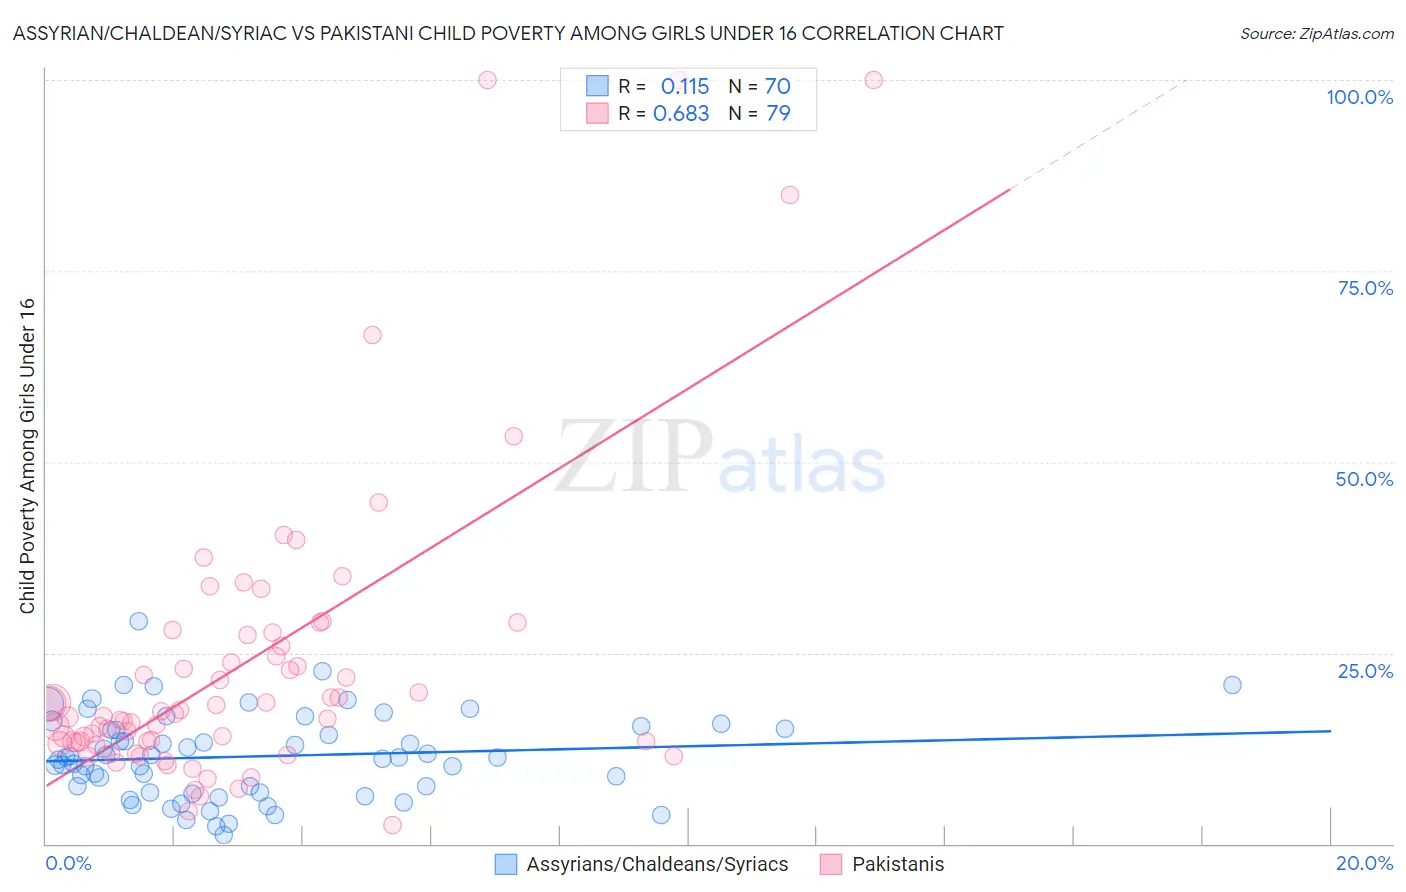
Assyrian/Chaldean/Syriac vs Pakistani Child Poverty Among Girls Under 16 Correlation Chart
The statistical analysis conducted on geographies consisting of 109,412,963 people shows a poor positive correlation between the proportion of Assyrians/Chaldeans/Syriacs and poverty level among girls under the age of 16 in the United States with a correlation coefficient (R) of 0.115 and weighted average of 13.3%. Similarly, the statistical analysis conducted on geographies consisting of 331,174,379 people shows a significant positive correlation between the proportion of Pakistanis and poverty level among girls under the age of 16 in the United States with a correlation coefficient (R) of 0.683 and weighted average of 15.3%, a difference of 15.0%.
Child Poverty Among Girls Under 16 Correlation Summary
| Measurement | Assyrian/Chaldean/Syriac | Pakistani |
| Minimum | 1.1% | 2.5% |
| Maximum | 29.1% | 100.0% |
| Range | 28.0% | 97.5% |
| Mean | 11.4% | 23.5% |
| Median | 11.3% | 16.7% |
| Interquartile 25% (IQ1) | 6.8% | 13.2% |
| Interquartile 75% (IQ3) | 15.0% | 27.3% |
| Interquartile Range (IQR) | 8.3% | 14.1% |
| Standard Deviation (Sample) | 5.6% | 20.1% |
| Standard Deviation (Population) | 5.5% | 20.0% |
Similar Demographics by Child Poverty Among Girls Under 16
Demographics Similar to Assyrians/Chaldeans/Syriacs by Child Poverty Among Girls Under 16
In terms of child poverty among girls under 16, the demographic groups most similar to Assyrians/Chaldeans/Syriacs are Immigrants from Japan (13.3%, a difference of 0.12%), Indian (Asian) (13.3%, a difference of 0.20%), Norwegian (13.3%, a difference of 0.37%), Immigrants from Eastern Asia (13.4%, a difference of 0.46%), and Cypriot (13.2%, a difference of 0.78%).
| Demographics | Rating | Rank | Child Poverty Among Girls Under 16 |
| Burmese | 99.9 /100 | #14 | Exceptional 13.0% |
| Okinawans | 99.9 /100 | #15 | Exceptional 13.0% |
| Immigrants | Lithuania | 99.9 /100 | #16 | Exceptional 13.1% |
| Bulgarians | 99.9 /100 | #17 | Exceptional 13.1% |
| Immigrants | Korea | 99.9 /100 | #18 | Exceptional 13.1% |
| Cypriots | 99.9 /100 | #19 | Exceptional 13.2% |
| Immigrants | Japan | 99.9 /100 | #20 | Exceptional 13.3% |
| Assyrians/Chaldeans/Syriacs | 99.9 /100 | #21 | Exceptional 13.3% |
| Indians (Asian) | 99.9 /100 | #22 | Exceptional 13.3% |
| Norwegians | 99.9 /100 | #23 | Exceptional 13.3% |
| Immigrants | Eastern Asia | 99.9 /100 | #24 | Exceptional 13.4% |
| Immigrants | China | 99.8 /100 | #25 | Exceptional 13.4% |
| Eastern Europeans | 99.8 /100 | #26 | Exceptional 13.5% |
| Latvians | 99.8 /100 | #27 | Exceptional 13.5% |
| Tongans | 99.8 /100 | #28 | Exceptional 13.6% |
Demographics Similar to Pakistanis by Child Poverty Among Girls Under 16
In terms of child poverty among girls under 16, the demographic groups most similar to Pakistanis are English (15.3%, a difference of 0.020%), Immigrants from Zimbabwe (15.3%, a difference of 0.090%), Immigrants from Southern Europe (15.3%, a difference of 0.20%), Portuguese (15.3%, a difference of 0.21%), and Irish (15.3%, a difference of 0.31%).
| Demographics | Rating | Rank | Child Poverty Among Girls Under 16 |
| Dutch | 94.3 /100 | #113 | Exceptional 15.1% |
| Sri Lankans | 94.0 /100 | #114 | Exceptional 15.2% |
| Belgians | 93.9 /100 | #115 | Exceptional 15.2% |
| Immigrants | Denmark | 93.3 /100 | #116 | Exceptional 15.2% |
| Immigrants | North Macedonia | 93.1 /100 | #117 | Exceptional 15.2% |
| Immigrants | Southern Europe | 92.7 /100 | #118 | Exceptional 15.3% |
| Immigrants | Zimbabwe | 92.5 /100 | #119 | Exceptional 15.3% |
| Pakistanis | 92.3 /100 | #120 | Exceptional 15.3% |
| English | 92.2 /100 | #121 | Exceptional 15.3% |
| Portuguese | 91.8 /100 | #122 | Exceptional 15.3% |
| Irish | 91.5 /100 | #123 | Exceptional 15.3% |
| Carpatho Rusyns | 91.4 /100 | #124 | Exceptional 15.3% |
| Peruvians | 91.2 /100 | #125 | Exceptional 15.4% |
| Scottish | 91.0 /100 | #126 | Exceptional 15.4% |
| Immigrants | Norway | 90.8 /100 | #127 | Exceptional 15.4% |