Immigrants from Yemen vs Pakistani Child Poverty Among Girls Under 16
COMPARE
Immigrants from Yemen
Pakistani
Child Poverty Among Girls Under 16
Child Poverty Among Girls Under 16 Comparison
Immigrants from Yemen
Pakistanis
29.5%
CHILD POVERTY AMONG GIRLS UNDER 16
0.0/ 100
METRIC RATING
343rd/ 347
METRIC RANK
15.3%
CHILD POVERTY AMONG GIRLS UNDER 16
92.3/ 100
METRIC RATING
120th/ 347
METRIC RANK
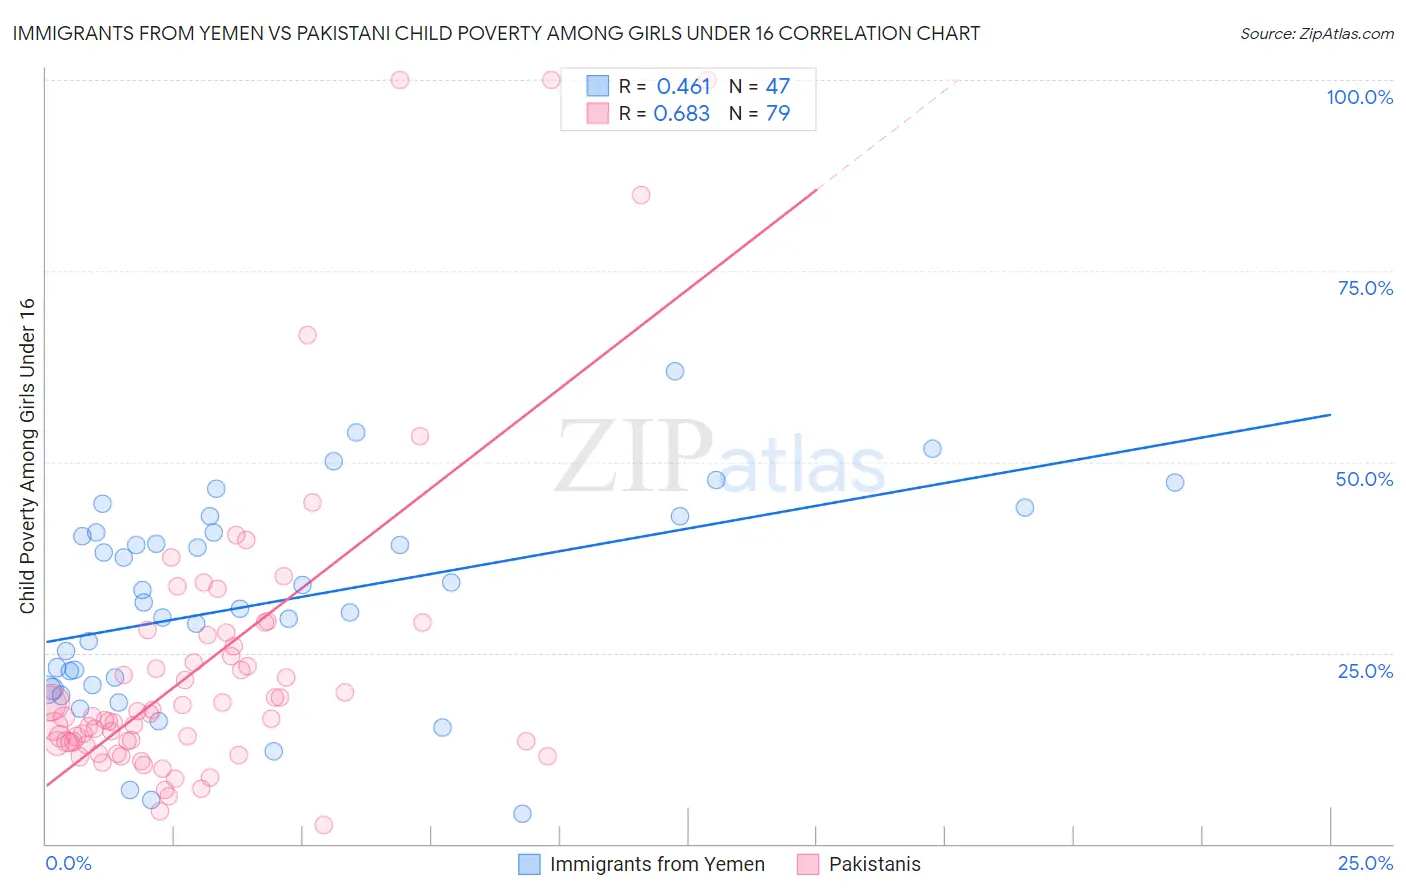
Immigrants from Yemen vs Pakistani Child Poverty Among Girls Under 16 Correlation Chart
The statistical analysis conducted on geographies consisting of 82,295,709 people shows a moderate positive correlation between the proportion of Immigrants from Yemen and poverty level among girls under the age of 16 in the United States with a correlation coefficient (R) of 0.461 and weighted average of 29.5%. Similarly, the statistical analysis conducted on geographies consisting of 331,174,379 people shows a significant positive correlation between the proportion of Pakistanis and poverty level among girls under the age of 16 in the United States with a correlation coefficient (R) of 0.683 and weighted average of 15.3%, a difference of 92.8%.
Child Poverty Among Girls Under 16 Correlation Summary
| Measurement | Immigrants from Yemen | Pakistani |
| Minimum | 3.9% | 2.5% |
| Maximum | 61.8% | 100.0% |
| Range | 57.9% | 97.5% |
| Mean | 31.7% | 23.5% |
| Median | 31.7% | 16.7% |
| Interquartile 25% (IQ1) | 20.8% | 13.2% |
| Interquartile 75% (IQ3) | 40.8% | 27.3% |
| Interquartile Range (IQR) | 20.0% | 14.1% |
| Standard Deviation (Sample) | 13.4% | 20.1% |
| Standard Deviation (Population) | 13.2% | 20.0% |
Similar Demographics by Child Poverty Among Girls Under 16
Demographics Similar to Immigrants from Yemen by Child Poverty Among Girls Under 16
In terms of child poverty among girls under 16, the demographic groups most similar to Immigrants from Yemen are Navajo (30.5%, a difference of 3.3%), Lumbee (30.7%, a difference of 4.1%), Pima (28.2%, a difference of 4.5%), Hopi (27.9%, a difference of 5.9%), and Tohono O'odham (31.6%, a difference of 7.2%).
| Demographics | Rating | Rank | Child Poverty Among Girls Under 16 |
| Blacks/African Americans | 0.0 /100 | #333 | Tragic 24.7% |
| Menominee | 0.0 /100 | #334 | Tragic 25.0% |
| Pueblo | 0.0 /100 | #335 | Tragic 25.2% |
| Sioux | 0.0 /100 | #336 | Tragic 25.6% |
| Yup'ik | 0.0 /100 | #337 | Tragic 25.8% |
| Cheyenne | 0.0 /100 | #338 | Tragic 26.3% |
| Crow | 0.0 /100 | #339 | Tragic 26.4% |
| Yuman | 0.0 /100 | #340 | Tragic 27.1% |
| Hopi | 0.0 /100 | #341 | Tragic 27.9% |
| Pima | 0.0 /100 | #342 | Tragic 28.2% |
| Immigrants | Yemen | 0.0 /100 | #343 | Tragic 29.5% |
| Navajo | 0.0 /100 | #344 | Tragic 30.5% |
| Lumbee | 0.0 /100 | #345 | Tragic 30.7% |
| Tohono O'odham | 0.0 /100 | #346 | Tragic 31.6% |
| Puerto Ricans | 0.0 /100 | #347 | Tragic 32.7% |
Demographics Similar to Pakistanis by Child Poverty Among Girls Under 16
In terms of child poverty among girls under 16, the demographic groups most similar to Pakistanis are English (15.3%, a difference of 0.020%), Immigrants from Zimbabwe (15.3%, a difference of 0.090%), Immigrants from Southern Europe (15.3%, a difference of 0.20%), Portuguese (15.3%, a difference of 0.21%), and Irish (15.3%, a difference of 0.31%).
| Demographics | Rating | Rank | Child Poverty Among Girls Under 16 |
| Dutch | 94.3 /100 | #113 | Exceptional 15.1% |
| Sri Lankans | 94.0 /100 | #114 | Exceptional 15.2% |
| Belgians | 93.9 /100 | #115 | Exceptional 15.2% |
| Immigrants | Denmark | 93.3 /100 | #116 | Exceptional 15.2% |
| Immigrants | North Macedonia | 93.1 /100 | #117 | Exceptional 15.2% |
| Immigrants | Southern Europe | 92.7 /100 | #118 | Exceptional 15.3% |
| Immigrants | Zimbabwe | 92.5 /100 | #119 | Exceptional 15.3% |
| Pakistanis | 92.3 /100 | #120 | Exceptional 15.3% |
| English | 92.2 /100 | #121 | Exceptional 15.3% |
| Portuguese | 91.8 /100 | #122 | Exceptional 15.3% |
| Irish | 91.5 /100 | #123 | Exceptional 15.3% |
| Carpatho Rusyns | 91.4 /100 | #124 | Exceptional 15.3% |
| Peruvians | 91.2 /100 | #125 | Exceptional 15.4% |
| Scottish | 91.0 /100 | #126 | Exceptional 15.4% |
| Immigrants | Norway | 90.8 /100 | #127 | Exceptional 15.4% |