Immigrants from Belgium vs Ute Female Poverty
COMPARE
Immigrants from Belgium
Ute
Female Poverty
Female Poverty Comparison
Immigrants from Belgium
Ute
12.2%
FEMALE POVERTY
97.7/ 100
METRIC RATING
70th/ 347
METRIC RANK
17.5%
FEMALE POVERTY
0.0/ 100
METRIC RATING
318th/ 347
METRIC RANK
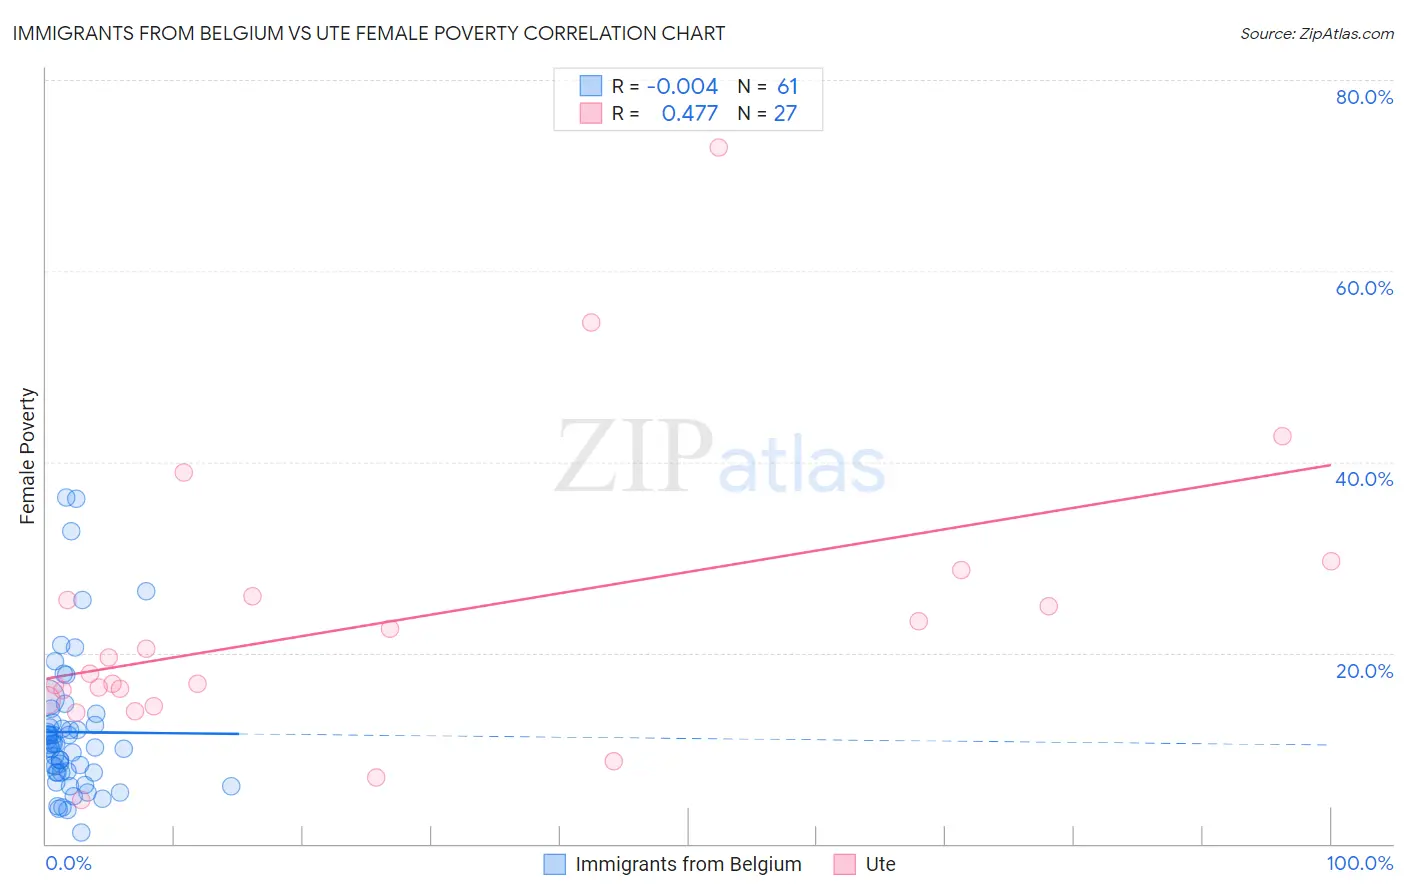
Immigrants from Belgium vs Ute Female Poverty Correlation Chart
The statistical analysis conducted on geographies consisting of 146,675,363 people shows no correlation between the proportion of Immigrants from Belgium and poverty level among females in the United States with a correlation coefficient (R) of -0.004 and weighted average of 12.2%. Similarly, the statistical analysis conducted on geographies consisting of 55,666,863 people shows a moderate positive correlation between the proportion of Ute and poverty level among females in the United States with a correlation coefficient (R) of 0.477 and weighted average of 17.5%, a difference of 42.7%.
Female Poverty Correlation Summary
| Measurement | Immigrants from Belgium | Ute |
| Minimum | 1.1% | 4.6% |
| Maximum | 36.2% | 73.0% |
| Range | 35.1% | 68.4% |
| Mean | 11.7% | 23.1% |
| Median | 10.4% | 17.9% |
| Interquartile 25% (IQ1) | 7.5% | 15.1% |
| Interquartile 75% (IQ3) | 12.6% | 25.9% |
| Interquartile Range (IQR) | 5.1% | 10.9% |
| Standard Deviation (Sample) | 7.3% | 14.7% |
| Standard Deviation (Population) | 7.3% | 14.5% |
Similar Demographics by Female Poverty
Demographics Similar to Immigrants from Belgium by Female Poverty
In terms of female poverty, the demographic groups most similar to Immigrants from Belgium are Swiss (12.2%, a difference of 0.030%), Immigrants from Netherlands (12.2%, a difference of 0.13%), Carpatho Rusyn (12.2%, a difference of 0.13%), Cambodian (12.2%, a difference of 0.16%), and Immigrants from Eastern Asia (12.2%, a difference of 0.17%).
| Demographics | Rating | Rank | Female Poverty |
| Ukrainians | 98.0 /100 | #63 | Exceptional 12.2% |
| Germans | 98.0 /100 | #64 | Exceptional 12.2% |
| Indians (Asian) | 97.9 /100 | #65 | Exceptional 12.2% |
| Austrians | 97.9 /100 | #66 | Exceptional 12.2% |
| Immigrants | Eastern Asia | 97.8 /100 | #67 | Exceptional 12.2% |
| Immigrants | Netherlands | 97.8 /100 | #68 | Exceptional 12.2% |
| Swiss | 97.7 /100 | #69 | Exceptional 12.2% |
| Immigrants | Belgium | 97.7 /100 | #70 | Exceptional 12.2% |
| Carpatho Rusyns | 97.6 /100 | #71 | Exceptional 12.2% |
| Cambodians | 97.5 /100 | #72 | Exceptional 12.2% |
| Zimbabweans | 97.5 /100 | #73 | Exceptional 12.3% |
| Immigrants | Canada | 97.5 /100 | #74 | Exceptional 12.3% |
| Europeans | 97.4 /100 | #75 | Exceptional 12.3% |
| Immigrants | Eastern Europe | 97.2 /100 | #76 | Exceptional 12.3% |
| Serbians | 97.2 /100 | #77 | Exceptional 12.3% |
Demographics Similar to Ute by Female Poverty
In terms of female poverty, the demographic groups most similar to Ute are Cajun (17.5%, a difference of 0.010%), Immigrants from Dominica (17.5%, a difference of 0.10%), Arapaho (17.5%, a difference of 0.16%), Immigrants from Congo (17.4%, a difference of 0.32%), and Honduran (17.4%, a difference of 0.52%).
| Demographics | Rating | Rank | Female Poverty |
| Immigrants | Guatemala | 0.0 /100 | #311 | Tragic 17.0% |
| Immigrants | Somalia | 0.0 /100 | #312 | Tragic 17.0% |
| British West Indians | 0.0 /100 | #313 | Tragic 17.0% |
| Dutch West Indians | 0.0 /100 | #314 | Tragic 17.1% |
| U.S. Virgin Islanders | 0.0 /100 | #315 | Tragic 17.3% |
| Hondurans | 0.0 /100 | #316 | Tragic 17.4% |
| Immigrants | Congo | 0.0 /100 | #317 | Tragic 17.4% |
| Ute | 0.0 /100 | #318 | Tragic 17.5% |
| Cajuns | 0.0 /100 | #319 | Tragic 17.5% |
| Immigrants | Dominica | 0.0 /100 | #320 | Tragic 17.5% |
| Arapaho | 0.0 /100 | #321 | Tragic 17.5% |
| Menominee | 0.0 /100 | #322 | Tragic 17.6% |
| Paiute | 0.0 /100 | #323 | Tragic 17.7% |
| Immigrants | Honduras | 0.0 /100 | #324 | Tragic 17.7% |
| Colville | 0.0 /100 | #325 | Tragic 17.8% |