Immigrants from Belgium vs Immigrants from Middle Africa Female Poverty
COMPARE
Immigrants from Belgium
Immigrants from Middle Africa
Female Poverty
Female Poverty Comparison
Immigrants from Belgium
Immigrants from Middle Africa
12.2%
FEMALE POVERTY
97.7/ 100
METRIC RATING
70th/ 347
METRIC RANK
15.2%
FEMALE POVERTY
0.5/ 100
METRIC RATING
239th/ 347
METRIC RANK
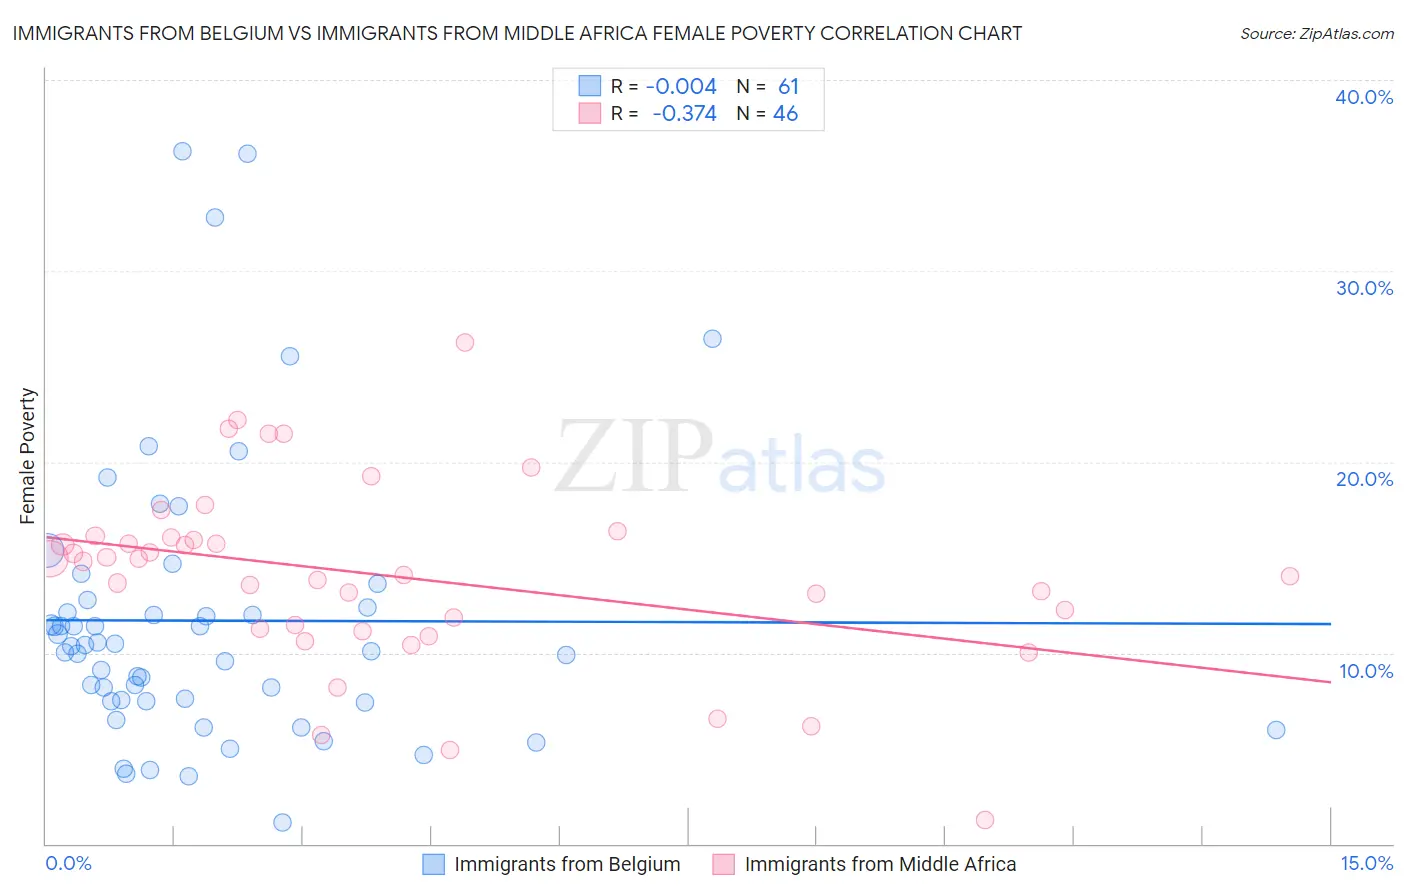
Immigrants from Belgium vs Immigrants from Middle Africa Female Poverty Correlation Chart
The statistical analysis conducted on geographies consisting of 146,675,363 people shows no correlation between the proportion of Immigrants from Belgium and poverty level among females in the United States with a correlation coefficient (R) of -0.004 and weighted average of 12.2%. Similarly, the statistical analysis conducted on geographies consisting of 202,623,141 people shows a mild negative correlation between the proportion of Immigrants from Middle Africa and poverty level among females in the United States with a correlation coefficient (R) of -0.374 and weighted average of 15.2%, a difference of 24.0%.
Female Poverty Correlation Summary
| Measurement | Immigrants from Belgium | Immigrants from Middle Africa |
| Minimum | 1.1% | 1.2% |
| Maximum | 36.2% | 26.2% |
| Range | 35.1% | 25.0% |
| Mean | 11.7% | 14.0% |
| Median | 10.4% | 14.4% |
| Interquartile 25% (IQ1) | 7.5% | 11.2% |
| Interquartile 75% (IQ3) | 12.6% | 16.0% |
| Interquartile Range (IQR) | 5.1% | 4.8% |
| Standard Deviation (Sample) | 7.3% | 4.9% |
| Standard Deviation (Population) | 7.3% | 4.8% |
Similar Demographics by Female Poverty
Demographics Similar to Immigrants from Belgium by Female Poverty
In terms of female poverty, the demographic groups most similar to Immigrants from Belgium are Swiss (12.2%, a difference of 0.030%), Immigrants from Netherlands (12.2%, a difference of 0.13%), Carpatho Rusyn (12.2%, a difference of 0.13%), Cambodian (12.2%, a difference of 0.16%), and Immigrants from Eastern Asia (12.2%, a difference of 0.17%).
| Demographics | Rating | Rank | Female Poverty |
| Ukrainians | 98.0 /100 | #63 | Exceptional 12.2% |
| Germans | 98.0 /100 | #64 | Exceptional 12.2% |
| Indians (Asian) | 97.9 /100 | #65 | Exceptional 12.2% |
| Austrians | 97.9 /100 | #66 | Exceptional 12.2% |
| Immigrants | Eastern Asia | 97.8 /100 | #67 | Exceptional 12.2% |
| Immigrants | Netherlands | 97.8 /100 | #68 | Exceptional 12.2% |
| Swiss | 97.7 /100 | #69 | Exceptional 12.2% |
| Immigrants | Belgium | 97.7 /100 | #70 | Exceptional 12.2% |
| Carpatho Rusyns | 97.6 /100 | #71 | Exceptional 12.2% |
| Cambodians | 97.5 /100 | #72 | Exceptional 12.2% |
| Zimbabweans | 97.5 /100 | #73 | Exceptional 12.3% |
| Immigrants | Canada | 97.5 /100 | #74 | Exceptional 12.3% |
| Europeans | 97.4 /100 | #75 | Exceptional 12.3% |
| Immigrants | Eastern Europe | 97.2 /100 | #76 | Exceptional 12.3% |
| Serbians | 97.2 /100 | #77 | Exceptional 12.3% |
Demographics Similar to Immigrants from Middle Africa by Female Poverty
In terms of female poverty, the demographic groups most similar to Immigrants from Middle Africa are Sudanese (15.2%, a difference of 0.050%), Immigrants from Sudan (15.2%, a difference of 0.30%), Nepalese (15.2%, a difference of 0.42%), Immigrants from Armenia (15.1%, a difference of 0.52%), and French American Indian (15.1%, a difference of 0.59%).
| Demographics | Rating | Rank | Female Poverty |
| Osage | 1.5 /100 | #232 | Tragic 14.8% |
| Immigrants | Saudi Arabia | 1.4 /100 | #233 | Tragic 14.8% |
| Fijians | 1.1 /100 | #234 | Tragic 14.9% |
| Immigrants | Laos | 0.9 /100 | #235 | Tragic 15.0% |
| Cree | 0.7 /100 | #236 | Tragic 15.1% |
| French American Indians | 0.6 /100 | #237 | Tragic 15.1% |
| Immigrants | Armenia | 0.6 /100 | #238 | Tragic 15.1% |
| Immigrants | Middle Africa | 0.5 /100 | #239 | Tragic 15.2% |
| Sudanese | 0.5 /100 | #240 | Tragic 15.2% |
| Immigrants | Sudan | 0.4 /100 | #241 | Tragic 15.2% |
| Nepalese | 0.4 /100 | #242 | Tragic 15.2% |
| Nicaraguans | 0.3 /100 | #243 | Tragic 15.3% |
| Ecuadorians | 0.3 /100 | #244 | Tragic 15.3% |
| Spanish American Indians | 0.3 /100 | #245 | Tragic 15.3% |
| Cubans | 0.3 /100 | #246 | Tragic 15.3% |