Immigrants from Belgium vs Cherokee Female Poverty
COMPARE
Immigrants from Belgium
Cherokee
Female Poverty
Female Poverty Comparison
Immigrants from Belgium
Cherokee
12.2%
FEMALE POVERTY
97.7/ 100
METRIC RATING
70th/ 347
METRIC RANK
15.6%
FEMALE POVERTY
0.1/ 100
METRIC RATING
263rd/ 347
METRIC RANK
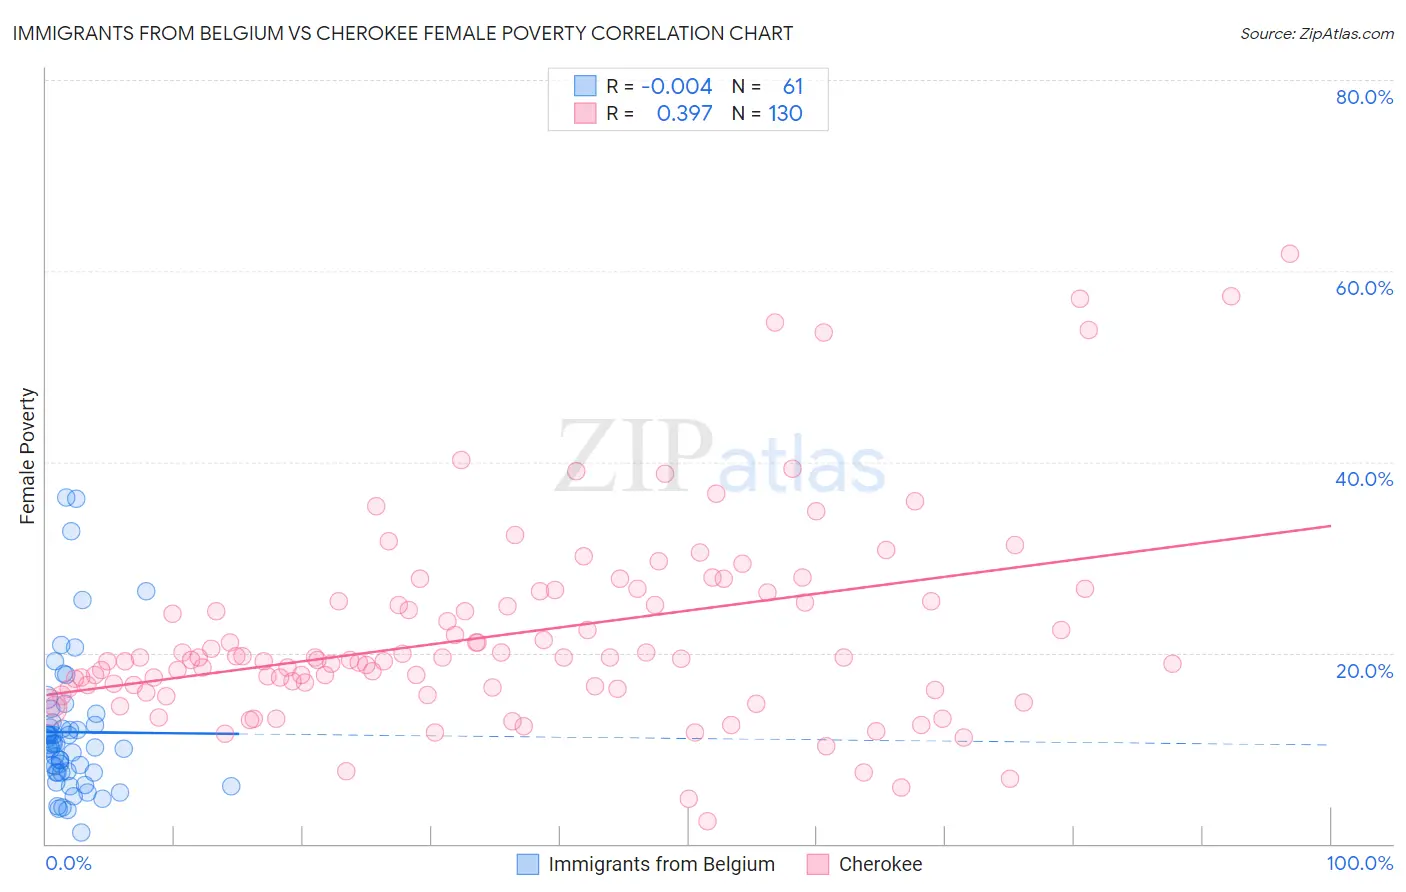
Immigrants from Belgium vs Cherokee Female Poverty Correlation Chart
The statistical analysis conducted on geographies consisting of 146,675,363 people shows no correlation between the proportion of Immigrants from Belgium and poverty level among females in the United States with a correlation coefficient (R) of -0.004 and weighted average of 12.2%. Similarly, the statistical analysis conducted on geographies consisting of 493,220,722 people shows a mild positive correlation between the proportion of Cherokee and poverty level among females in the United States with a correlation coefficient (R) of 0.397 and weighted average of 15.6%, a difference of 27.6%.
Female Poverty Correlation Summary
| Measurement | Immigrants from Belgium | Cherokee |
| Minimum | 1.1% | 2.3% |
| Maximum | 36.2% | 61.8% |
| Range | 35.1% | 59.5% |
| Mean | 11.7% | 21.9% |
| Median | 10.4% | 19.3% |
| Interquartile 25% (IQ1) | 7.5% | 16.3% |
| Interquartile 75% (IQ3) | 12.6% | 25.5% |
| Interquartile Range (IQR) | 5.1% | 9.2% |
| Standard Deviation (Sample) | 7.3% | 10.5% |
| Standard Deviation (Population) | 7.3% | 10.5% |
Similar Demographics by Female Poverty
Demographics Similar to Immigrants from Belgium by Female Poverty
In terms of female poverty, the demographic groups most similar to Immigrants from Belgium are Swiss (12.2%, a difference of 0.030%), Immigrants from Netherlands (12.2%, a difference of 0.13%), Carpatho Rusyn (12.2%, a difference of 0.13%), Cambodian (12.2%, a difference of 0.16%), and Immigrants from Eastern Asia (12.2%, a difference of 0.17%).
| Demographics | Rating | Rank | Female Poverty |
| Ukrainians | 98.0 /100 | #63 | Exceptional 12.2% |
| Germans | 98.0 /100 | #64 | Exceptional 12.2% |
| Indians (Asian) | 97.9 /100 | #65 | Exceptional 12.2% |
| Austrians | 97.9 /100 | #66 | Exceptional 12.2% |
| Immigrants | Eastern Asia | 97.8 /100 | #67 | Exceptional 12.2% |
| Immigrants | Netherlands | 97.8 /100 | #68 | Exceptional 12.2% |
| Swiss | 97.7 /100 | #69 | Exceptional 12.2% |
| Immigrants | Belgium | 97.7 /100 | #70 | Exceptional 12.2% |
| Carpatho Rusyns | 97.6 /100 | #71 | Exceptional 12.2% |
| Cambodians | 97.5 /100 | #72 | Exceptional 12.2% |
| Zimbabweans | 97.5 /100 | #73 | Exceptional 12.3% |
| Immigrants | Canada | 97.5 /100 | #74 | Exceptional 12.3% |
| Europeans | 97.4 /100 | #75 | Exceptional 12.3% |
| Immigrants | Eastern Europe | 97.2 /100 | #76 | Exceptional 12.3% |
| Serbians | 97.2 /100 | #77 | Exceptional 12.3% |
Demographics Similar to Cherokee by Female Poverty
In terms of female poverty, the demographic groups most similar to Cherokee are Guyanese (15.6%, a difference of 0.010%), Mexican American Indian (15.6%, a difference of 0.010%), Immigrants from Guyana (15.6%, a difference of 0.11%), Immigrants from Ecuador (15.6%, a difference of 0.13%), and Cape Verdean (15.6%, a difference of 0.19%).
| Demographics | Rating | Rank | Female Poverty |
| Jamaicans | 0.2 /100 | #256 | Tragic 15.5% |
| Immigrants | Jamaica | 0.1 /100 | #257 | Tragic 15.6% |
| Shoshone | 0.1 /100 | #258 | Tragic 15.6% |
| Cape Verdeans | 0.1 /100 | #259 | Tragic 15.6% |
| Immigrants | Guyana | 0.1 /100 | #260 | Tragic 15.6% |
| Guyanese | 0.1 /100 | #261 | Tragic 15.6% |
| Mexican American Indians | 0.1 /100 | #262 | Tragic 15.6% |
| Cherokee | 0.1 /100 | #263 | Tragic 15.6% |
| Immigrants | Ecuador | 0.1 /100 | #264 | Tragic 15.6% |
| Immigrants | Liberia | 0.1 /100 | #265 | Tragic 15.7% |
| Immigrants | El Salvador | 0.1 /100 | #266 | Tragic 15.7% |
| Sub-Saharan Africans | 0.1 /100 | #267 | Tragic 15.8% |
| Immigrants | Nicaragua | 0.1 /100 | #268 | Tragic 15.8% |
| Iroquois | 0.1 /100 | #269 | Tragic 15.8% |
| Chickasaw | 0.1 /100 | #270 | Tragic 15.9% |