Immigrants from Belgium vs Swiss Female Poverty
COMPARE
Immigrants from Belgium
Swiss
Female Poverty
Female Poverty Comparison
Immigrants from Belgium
Swiss
12.2%
FEMALE POVERTY
97.7/ 100
METRIC RATING
70th/ 347
METRIC RANK
12.2%
FEMALE POVERTY
97.7/ 100
METRIC RATING
69th/ 347
METRIC RANK
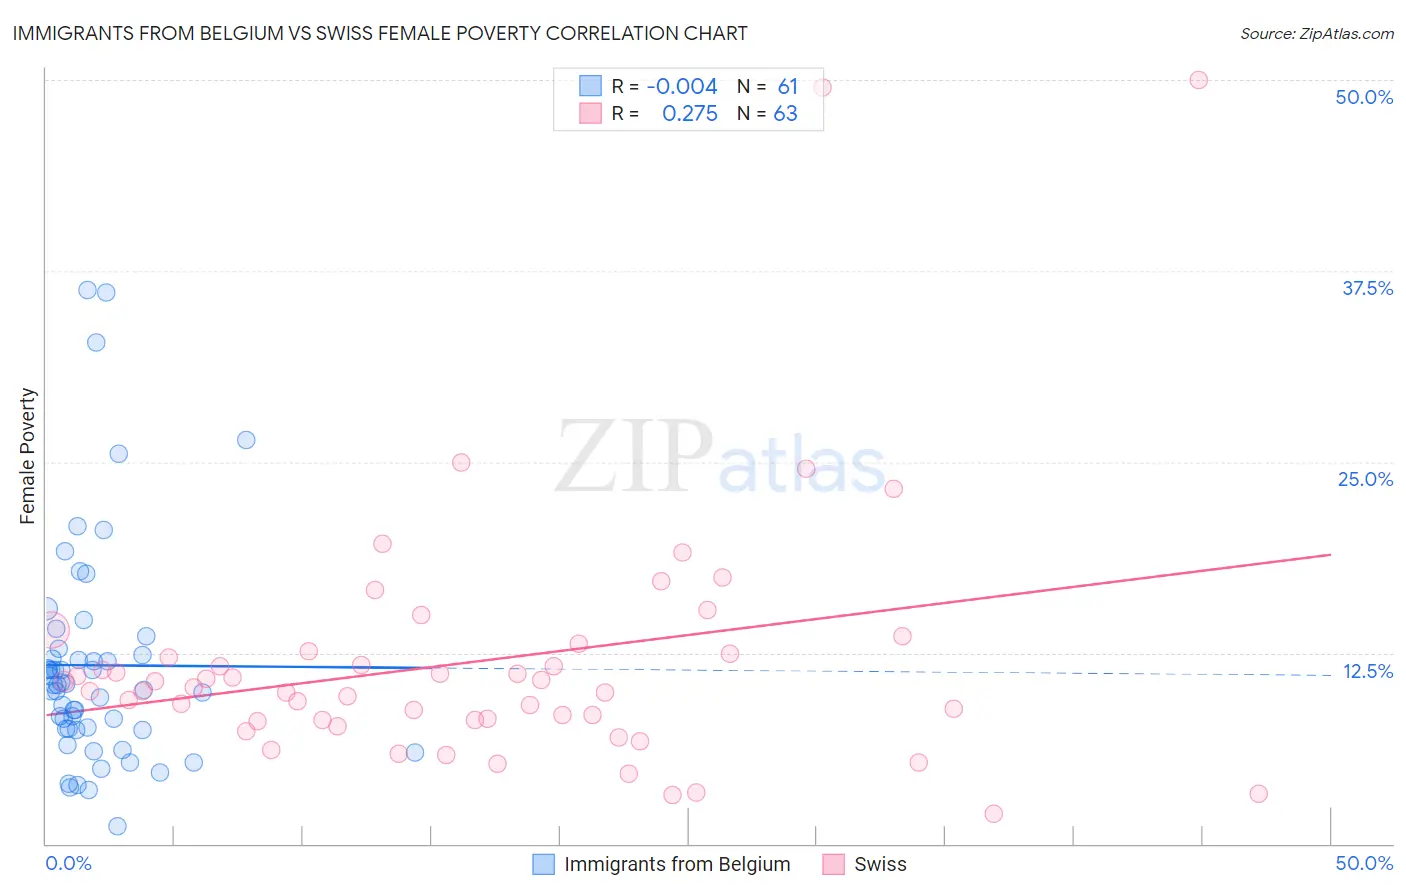
Immigrants from Belgium vs Swiss Female Poverty Correlation Chart
The statistical analysis conducted on geographies consisting of 146,675,363 people shows no correlation between the proportion of Immigrants from Belgium and poverty level among females in the United States with a correlation coefficient (R) of -0.004 and weighted average of 12.2%. Similarly, the statistical analysis conducted on geographies consisting of 464,552,447 people shows a weak positive correlation between the proportion of Swiss and poverty level among females in the United States with a correlation coefficient (R) of 0.275 and weighted average of 12.2%, a difference of 0.030%.
Female Poverty Correlation Summary
| Measurement | Immigrants from Belgium | Swiss |
| Minimum | 1.1% | 1.9% |
| Maximum | 36.2% | 50.0% |
| Range | 35.1% | 48.1% |
| Mean | 11.7% | 11.9% |
| Median | 10.4% | 10.2% |
| Interquartile 25% (IQ1) | 7.5% | 8.1% |
| Interquartile 75% (IQ3) | 12.6% | 12.6% |
| Interquartile Range (IQR) | 5.1% | 4.5% |
| Standard Deviation (Sample) | 7.3% | 8.4% |
| Standard Deviation (Population) | 7.3% | 8.3% |
Demographics Similar to Immigrants from Belgium and Swiss by Female Poverty
In terms of female poverty, the demographic groups most similar to Immigrants from Belgium are Immigrants from Netherlands (12.2%, a difference of 0.13%), Carpatho Rusyn (12.2%, a difference of 0.13%), Cambodian (12.2%, a difference of 0.16%), Immigrants from Eastern Asia (12.2%, a difference of 0.17%), and Zimbabwean (12.3%, a difference of 0.18%). Similarly, the demographic groups most similar to Swiss are Immigrants from Netherlands (12.2%, a difference of 0.10%), Immigrants from Eastern Asia (12.2%, a difference of 0.14%), Carpatho Rusyn (12.2%, a difference of 0.15%), Cambodian (12.2%, a difference of 0.19%), and Zimbabwean (12.3%, a difference of 0.21%).
| Demographics | Rating | Rank | Female Poverty |
| Immigrants | Europe | 98.2 /100 | #59 | Exceptional 12.1% |
| Immigrants | Australia | 98.1 /100 | #60 | Exceptional 12.2% |
| Immigrants | Asia | 98.1 /100 | #61 | Exceptional 12.2% |
| Immigrants | Italy | 98.0 /100 | #62 | Exceptional 12.2% |
| Ukrainians | 98.0 /100 | #63 | Exceptional 12.2% |
| Germans | 98.0 /100 | #64 | Exceptional 12.2% |
| Indians (Asian) | 97.9 /100 | #65 | Exceptional 12.2% |
| Austrians | 97.9 /100 | #66 | Exceptional 12.2% |
| Immigrants | Eastern Asia | 97.8 /100 | #67 | Exceptional 12.2% |
| Immigrants | Netherlands | 97.8 /100 | #68 | Exceptional 12.2% |
| Swiss | 97.7 /100 | #69 | Exceptional 12.2% |
| Immigrants | Belgium | 97.7 /100 | #70 | Exceptional 12.2% |
| Carpatho Rusyns | 97.6 /100 | #71 | Exceptional 12.2% |
| Cambodians | 97.5 /100 | #72 | Exceptional 12.2% |
| Zimbabweans | 97.5 /100 | #73 | Exceptional 12.3% |
| Immigrants | Canada | 97.5 /100 | #74 | Exceptional 12.3% |
| Europeans | 97.4 /100 | #75 | Exceptional 12.3% |
| Immigrants | Eastern Europe | 97.2 /100 | #76 | Exceptional 12.3% |
| Serbians | 97.2 /100 | #77 | Exceptional 12.3% |
| Egyptians | 97.2 /100 | #78 | Exceptional 12.3% |
| Immigrants | North America | 97.1 /100 | #79 | Exceptional 12.3% |