Immigrants from Belgium vs English Female Poverty
COMPARE
Immigrants from Belgium
English
Female Poverty
Female Poverty Comparison
Immigrants from Belgium
English
12.2%
FEMALE POVERTY
97.7/ 100
METRIC RATING
70th/ 347
METRIC RANK
12.4%
FEMALE POVERTY
96.1/ 100
METRIC RATING
89th/ 347
METRIC RANK
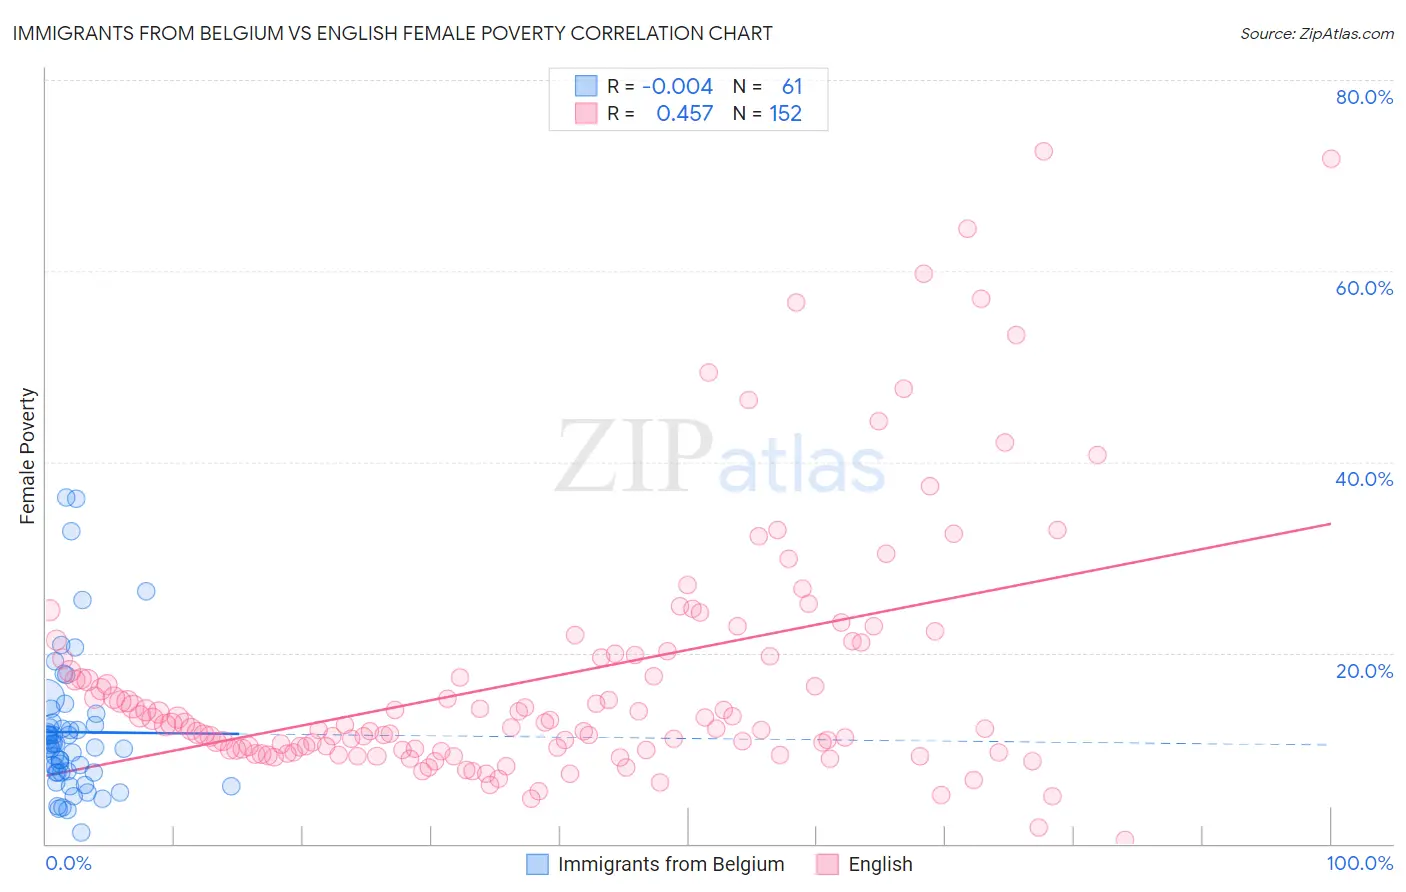
Immigrants from Belgium vs English Female Poverty Correlation Chart
The statistical analysis conducted on geographies consisting of 146,675,363 people shows no correlation between the proportion of Immigrants from Belgium and poverty level among females in the United States with a correlation coefficient (R) of -0.004 and weighted average of 12.2%. Similarly, the statistical analysis conducted on geographies consisting of 578,145,061 people shows a moderate positive correlation between the proportion of English and poverty level among females in the United States with a correlation coefficient (R) of 0.457 and weighted average of 12.4%, a difference of 1.4%.
Female Poverty Correlation Summary
| Measurement | Immigrants from Belgium | English |
| Minimum | 1.1% | 0.38% |
| Maximum | 36.2% | 72.5% |
| Range | 35.1% | 72.2% |
| Mean | 11.7% | 17.3% |
| Median | 10.4% | 12.4% |
| Interquartile 25% (IQ1) | 7.5% | 9.8% |
| Interquartile 75% (IQ3) | 12.6% | 19.7% |
| Interquartile Range (IQR) | 5.1% | 9.9% |
| Standard Deviation (Sample) | 7.3% | 13.4% |
| Standard Deviation (Population) | 7.3% | 13.3% |
Demographics Similar to Immigrants from Belgium and English by Female Poverty
In terms of female poverty, the demographic groups most similar to Immigrants from Belgium are Swiss (12.2%, a difference of 0.030%), Carpatho Rusyn (12.2%, a difference of 0.13%), Cambodian (12.2%, a difference of 0.16%), Zimbabwean (12.3%, a difference of 0.18%), and Immigrants from Canada (12.3%, a difference of 0.19%). Similarly, the demographic groups most similar to English are Finnish (12.4%, a difference of 0.20%), Okinawan (12.4%, a difference of 0.24%), Dutch (12.4%, a difference of 0.26%), Irish (12.4%, a difference of 0.29%), and Northern European (12.4%, a difference of 0.34%).
| Demographics | Rating | Rank | Female Poverty |
| Swiss | 97.7 /100 | #69 | Exceptional 12.2% |
| Immigrants | Belgium | 97.7 /100 | #70 | Exceptional 12.2% |
| Carpatho Rusyns | 97.6 /100 | #71 | Exceptional 12.2% |
| Cambodians | 97.5 /100 | #72 | Exceptional 12.2% |
| Zimbabweans | 97.5 /100 | #73 | Exceptional 12.3% |
| Immigrants | Canada | 97.5 /100 | #74 | Exceptional 12.3% |
| Europeans | 97.4 /100 | #75 | Exceptional 12.3% |
| Immigrants | Eastern Europe | 97.2 /100 | #76 | Exceptional 12.3% |
| Serbians | 97.2 /100 | #77 | Exceptional 12.3% |
| Egyptians | 97.2 /100 | #78 | Exceptional 12.3% |
| Immigrants | North America | 97.1 /100 | #79 | Exceptional 12.3% |
| Slovaks | 97.1 /100 | #80 | Exceptional 12.3% |
| Immigrants | Sweden | 97.1 /100 | #81 | Exceptional 12.3% |
| Jordanians | 97.1 /100 | #82 | Exceptional 12.3% |
| Immigrants | England | 96.9 /100 | #83 | Exceptional 12.3% |
| Northern Europeans | 96.6 /100 | #84 | Exceptional 12.4% |
| Irish | 96.5 /100 | #85 | Exceptional 12.4% |
| Dutch | 96.5 /100 | #86 | Exceptional 12.4% |
| Okinawans | 96.4 /100 | #87 | Exceptional 12.4% |
| Finns | 96.4 /100 | #88 | Exceptional 12.4% |
| English | 96.1 /100 | #89 | Exceptional 12.4% |