Immigrants from Bangladesh vs Crow Ambulatory Disability
COMPARE
Immigrants from Bangladesh
Crow
Ambulatory Disability
Ambulatory Disability Comparison
Immigrants from Bangladesh
Crow
6.2%
AMBULATORY DISABILITY
24.6/ 100
METRIC RATING
198th/ 347
METRIC RANK
6.9%
AMBULATORY DISABILITY
0.0/ 100
METRIC RATING
295th/ 347
METRIC RANK
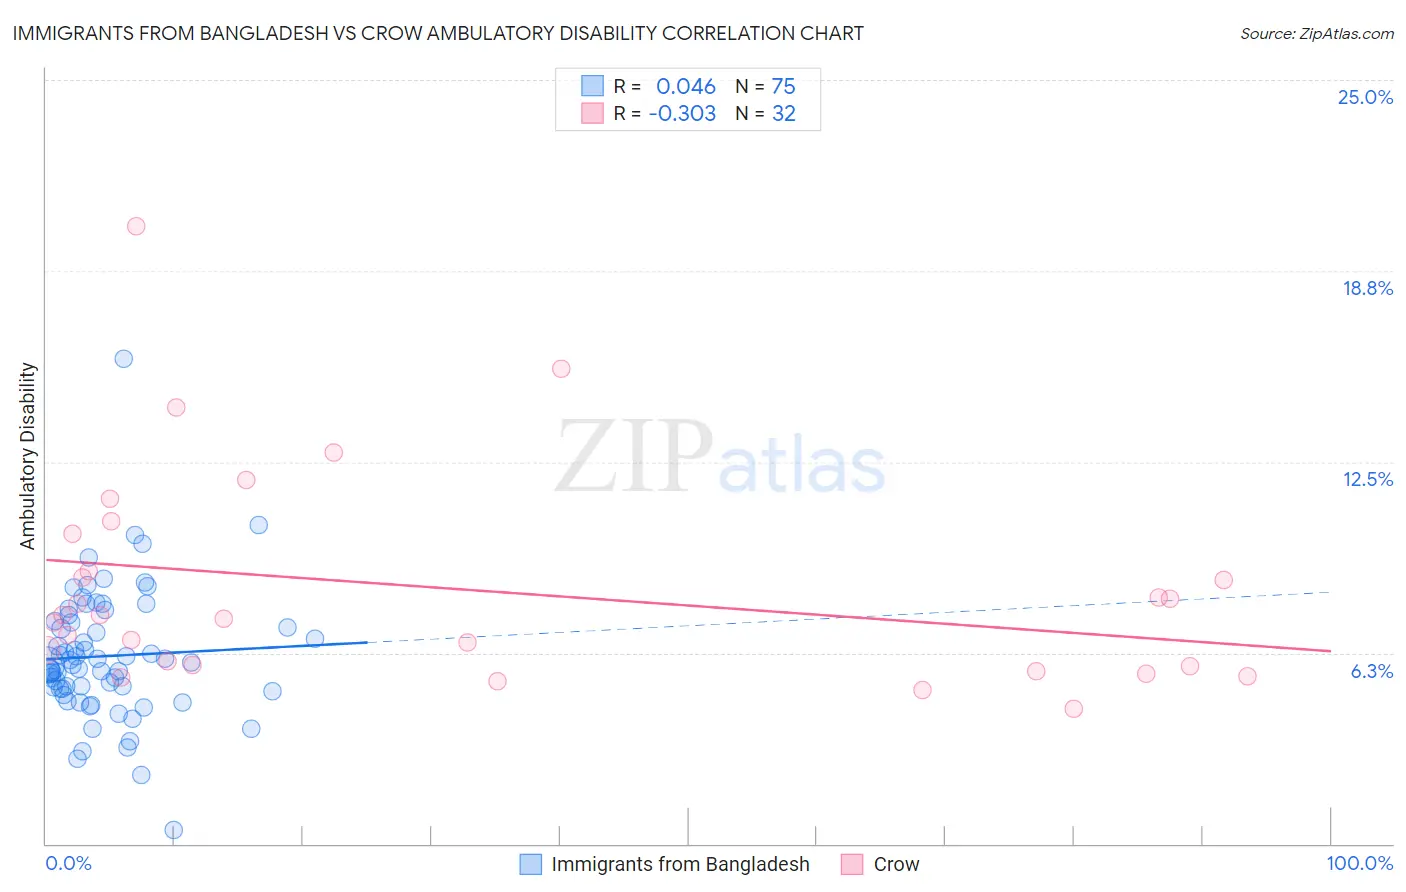
Immigrants from Bangladesh vs Crow Ambulatory Disability Correlation Chart
The statistical analysis conducted on geographies consisting of 203,637,177 people shows no correlation between the proportion of Immigrants from Bangladesh and percentage of population with ambulatory disability in the United States with a correlation coefficient (R) of 0.046 and weighted average of 6.2%. Similarly, the statistical analysis conducted on geographies consisting of 59,204,118 people shows a mild negative correlation between the proportion of Crow and percentage of population with ambulatory disability in the United States with a correlation coefficient (R) of -0.303 and weighted average of 6.9%, a difference of 11.3%.
Ambulatory Disability Correlation Summary
| Measurement | Immigrants from Bangladesh | Crow |
| Minimum | 0.46% | 4.4% |
| Maximum | 15.9% | 20.2% |
| Range | 15.4% | 15.8% |
| Mean | 6.1% | 8.4% |
| Median | 5.9% | 7.4% |
| Interquartile 25% (IQ1) | 5.1% | 5.8% |
| Interquartile 75% (IQ3) | 7.3% | 9.5% |
| Interquartile Range (IQR) | 2.2% | 3.7% |
| Standard Deviation (Sample) | 2.1% | 3.5% |
| Standard Deviation (Population) | 2.1% | 3.4% |
Similar Demographics by Ambulatory Disability
Demographics Similar to Immigrants from Bangladesh by Ambulatory Disability
In terms of ambulatory disability, the demographic groups most similar to Immigrants from Bangladesh are Polish (6.2%, a difference of 0.12%), Italian (6.2%, a difference of 0.14%), Immigrants from Cambodia (6.2%, a difference of 0.22%), Malaysian (6.2%, a difference of 0.25%), and Belgian (6.2%, a difference of 0.27%).
| Demographics | Rating | Rank | Ambulatory Disability |
| Immigrants | Guatemala | 31.9 /100 | #191 | Fair 6.2% |
| Immigrants | Western Europe | 31.6 /100 | #192 | Fair 6.2% |
| Guatemalans | 30.0 /100 | #193 | Fair 6.2% |
| Alaska Natives | 29.8 /100 | #194 | Fair 6.2% |
| Belgians | 28.6 /100 | #195 | Fair 6.2% |
| Malaysians | 28.2 /100 | #196 | Fair 6.2% |
| Poles | 26.3 /100 | #197 | Fair 6.2% |
| Immigrants | Bangladesh | 24.6 /100 | #198 | Fair 6.2% |
| Italians | 22.6 /100 | #199 | Fair 6.2% |
| Immigrants | Cambodia | 21.5 /100 | #200 | Fair 6.2% |
| Immigrants | Central America | 20.1 /100 | #201 | Fair 6.2% |
| Albanians | 19.7 /100 | #202 | Poor 6.2% |
| Immigrants | Ukraine | 18.4 /100 | #203 | Poor 6.2% |
| Immigrants | Congo | 18.2 /100 | #204 | Poor 6.2% |
| Slovenes | 18.0 /100 | #205 | Poor 6.2% |
Demographics Similar to Crow by Ambulatory Disability
In terms of ambulatory disability, the demographic groups most similar to Crow are Cape Verdean (6.9%, a difference of 0.070%), Alaskan Athabascan (6.9%, a difference of 0.23%), Immigrants from St. Vincent and the Grenadines (6.9%, a difference of 0.26%), French American Indian (6.9%, a difference of 0.40%), and Immigrants from Grenada (6.9%, a difference of 0.41%).
| Demographics | Rating | Rank | Ambulatory Disability |
| Immigrants | Nonimmigrants | 0.0 /100 | #288 | Tragic 6.9% |
| Immigrants | Dominica | 0.0 /100 | #289 | Tragic 6.9% |
| Scotch-Irish | 0.0 /100 | #290 | Tragic 6.9% |
| West Indians | 0.0 /100 | #291 | Tragic 6.9% |
| Cheyenne | 0.0 /100 | #292 | Tragic 6.9% |
| Immigrants | St. Vincent and the Grenadines | 0.0 /100 | #293 | Tragic 6.9% |
| Cape Verdeans | 0.0 /100 | #294 | Tragic 6.9% |
| Crow | 0.0 /100 | #295 | Tragic 6.9% |
| Alaskan Athabascans | 0.0 /100 | #296 | Tragic 6.9% |
| French American Indians | 0.0 /100 | #297 | Tragic 6.9% |
| Immigrants | Grenada | 0.0 /100 | #298 | Tragic 6.9% |
| Puget Sound Salish | 0.0 /100 | #299 | Tragic 6.9% |
| Marshallese | 0.0 /100 | #300 | Tragic 6.9% |
| British West Indians | 0.0 /100 | #301 | Tragic 7.0% |
| Immigrants | Armenia | 0.0 /100 | #302 | Tragic 7.0% |