Immigrants from Bangladesh vs Burmese Male Poverty
COMPARE
Immigrants from Bangladesh
Burmese
Male Poverty
Male Poverty Comparison
Immigrants from Bangladesh
Burmese
14.1%
MALE POVERTY
0.0/ 100
METRIC RATING
305th/ 347
METRIC RANK
9.7%
MALE POVERTY
99.6/ 100
METRIC RATING
26th/ 347
METRIC RANK
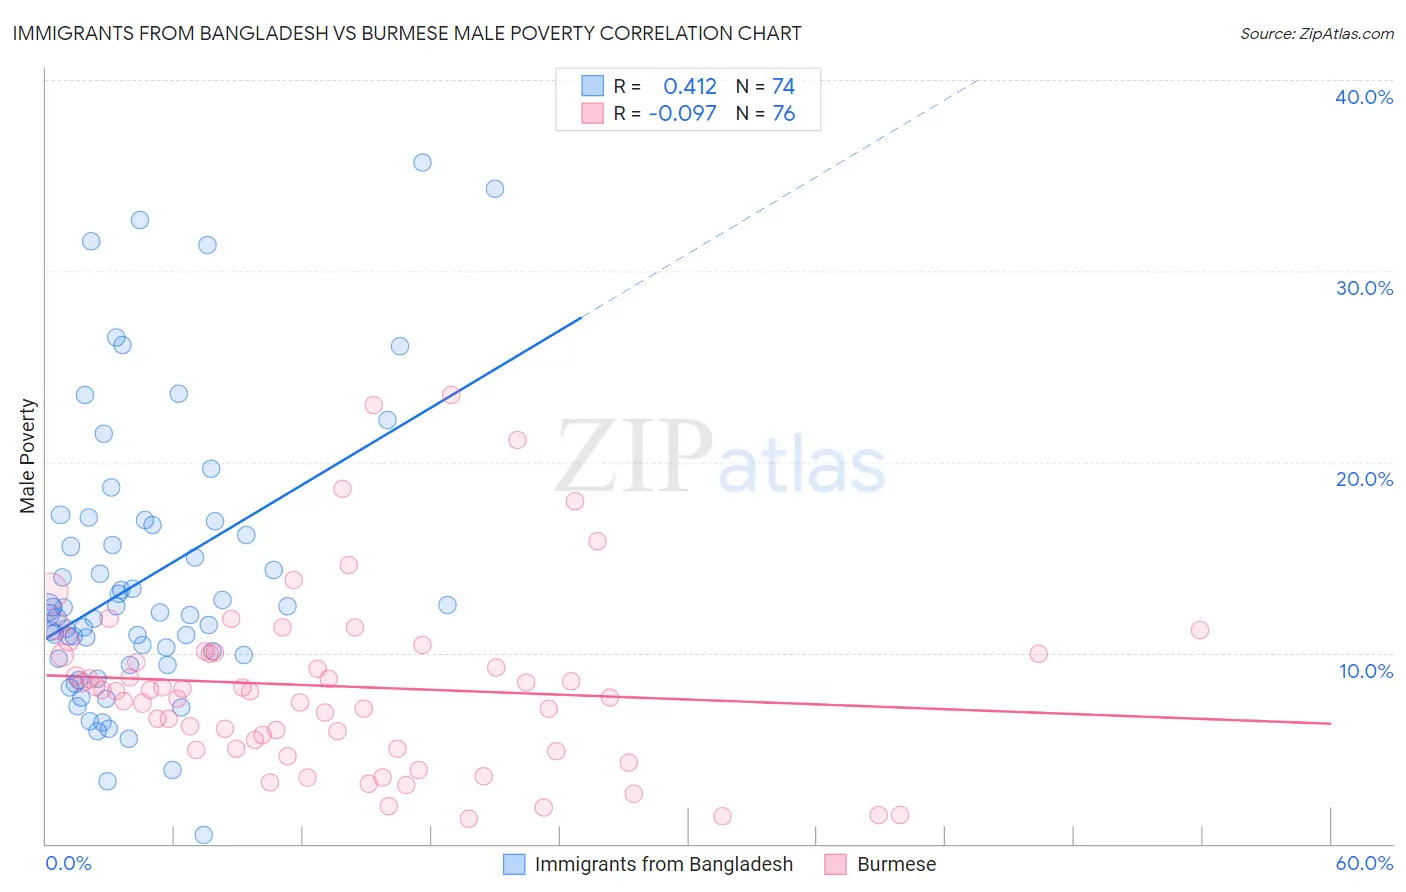
Immigrants from Bangladesh vs Burmese Male Poverty Correlation Chart
The statistical analysis conducted on geographies consisting of 203,544,271 people shows a moderate positive correlation between the proportion of Immigrants from Bangladesh and poverty level among males in the United States with a correlation coefficient (R) of 0.412 and weighted average of 14.1%. Similarly, the statistical analysis conducted on geographies consisting of 464,653,022 people shows a slight negative correlation between the proportion of Burmese and poverty level among males in the United States with a correlation coefficient (R) of -0.097 and weighted average of 9.7%, a difference of 45.6%.
Male Poverty Correlation Summary
| Measurement | Immigrants from Bangladesh | Burmese |
| Minimum | 0.44% | 1.3% |
| Maximum | 35.7% | 23.5% |
| Range | 35.2% | 22.2% |
| Mean | 13.9% | 8.2% |
| Median | 12.1% | 8.0% |
| Interquartile 25% (IQ1) | 9.7% | 5.0% |
| Interquartile 75% (IQ3) | 16.7% | 10.0% |
| Interquartile Range (IQR) | 7.0% | 5.1% |
| Standard Deviation (Sample) | 7.4% | 4.7% |
| Standard Deviation (Population) | 7.3% | 4.7% |
Similar Demographics by Male Poverty
Demographics Similar to Immigrants from Bangladesh by Male Poverty
In terms of male poverty, the demographic groups most similar to Immigrants from Bangladesh are Creek (14.1%, a difference of 0.070%), Senegalese (14.1%, a difference of 0.21%), Bahamian (14.1%, a difference of 0.32%), Immigrants from Caribbean (14.0%, a difference of 0.36%), and Immigrants from Senegal (14.0%, a difference of 0.42%).
| Demographics | Rating | Rank | Male Poverty |
| Blackfeet | 0.0 /100 | #298 | Tragic 14.0% |
| Immigrants | Guatemala | 0.0 /100 | #299 | Tragic 14.0% |
| Immigrants | Mexico | 0.0 /100 | #300 | Tragic 14.0% |
| Immigrants | Senegal | 0.0 /100 | #301 | Tragic 14.0% |
| Immigrants | Caribbean | 0.0 /100 | #302 | Tragic 14.0% |
| Bahamians | 0.0 /100 | #303 | Tragic 14.1% |
| Senegalese | 0.0 /100 | #304 | Tragic 14.1% |
| Immigrants | Bangladesh | 0.0 /100 | #305 | Tragic 14.1% |
| Creek | 0.0 /100 | #306 | Tragic 14.1% |
| Dutch West Indians | 0.0 /100 | #307 | Tragic 14.2% |
| Africans | 0.0 /100 | #308 | Tragic 14.2% |
| Somalis | 0.0 /100 | #309 | Tragic 14.3% |
| Seminole | 0.0 /100 | #310 | Tragic 14.3% |
| Hondurans | 0.0 /100 | #311 | Tragic 14.3% |
| Choctaw | 0.0 /100 | #312 | Tragic 14.4% |
Demographics Similar to Burmese by Male Poverty
In terms of male poverty, the demographic groups most similar to Burmese are Danish (9.7%, a difference of 0.13%), Immigrants from Korea (9.7%, a difference of 0.21%), Greek (9.7%, a difference of 0.25%), Polish (9.7%, a difference of 0.33%), and Tongan (9.7%, a difference of 0.35%).
| Demographics | Rating | Rank | Male Poverty |
| Immigrants | Hong Kong | 99.7 /100 | #19 | Exceptional 9.6% |
| Latvians | 99.7 /100 | #20 | Exceptional 9.6% |
| Immigrants | Scotland | 99.7 /100 | #21 | Exceptional 9.6% |
| Croatians | 99.7 /100 | #22 | Exceptional 9.6% |
| Italians | 99.7 /100 | #23 | Exceptional 9.6% |
| Swedes | 99.7 /100 | #24 | Exceptional 9.6% |
| Eastern Europeans | 99.6 /100 | #25 | Exceptional 9.6% |
| Burmese | 99.6 /100 | #26 | Exceptional 9.7% |
| Danes | 99.6 /100 | #27 | Exceptional 9.7% |
| Immigrants | Korea | 99.6 /100 | #28 | Exceptional 9.7% |
| Greeks | 99.6 /100 | #29 | Exceptional 9.7% |
| Poles | 99.5 /100 | #30 | Exceptional 9.7% |
| Tongans | 99.5 /100 | #31 | Exceptional 9.7% |
| Macedonians | 99.5 /100 | #32 | Exceptional 9.7% |
| Immigrants | Northern Europe | 99.5 /100 | #33 | Exceptional 9.7% |