Immigrants from Bangladesh vs Central American Male Poverty
COMPARE
Immigrants from Bangladesh
Central American
Male Poverty
Male Poverty Comparison
Immigrants from Bangladesh
Central Americans
14.1%
MALE POVERTY
0.0/ 100
METRIC RATING
305th/ 347
METRIC RANK
13.2%
MALE POVERTY
0.1/ 100
METRIC RATING
263rd/ 347
METRIC RANK
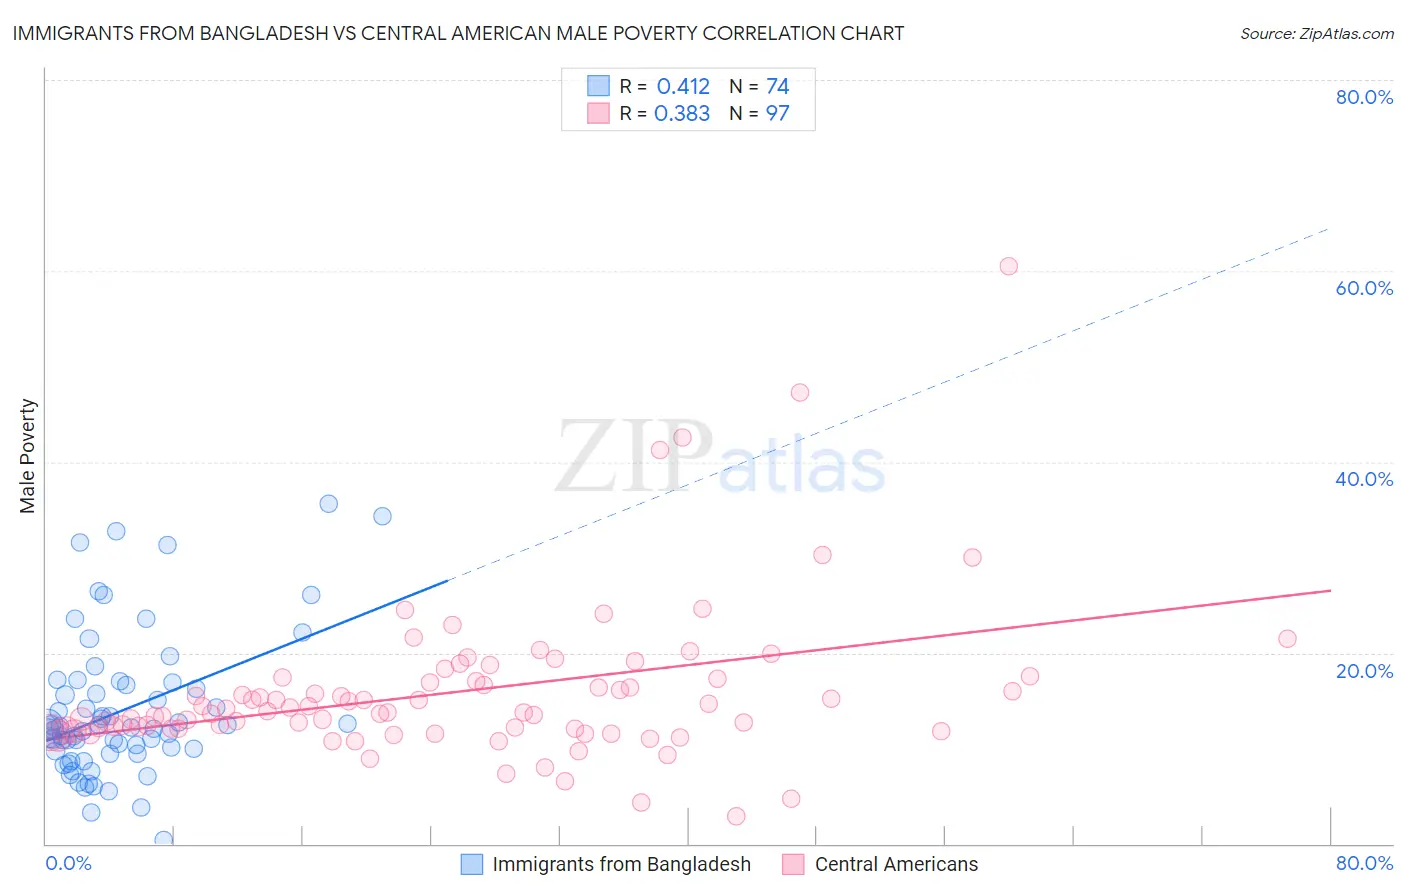
Immigrants from Bangladesh vs Central American Male Poverty Correlation Chart
The statistical analysis conducted on geographies consisting of 203,544,271 people shows a moderate positive correlation between the proportion of Immigrants from Bangladesh and poverty level among males in the United States with a correlation coefficient (R) of 0.412 and weighted average of 14.1%. Similarly, the statistical analysis conducted on geographies consisting of 503,856,624 people shows a mild positive correlation between the proportion of Central Americans and poverty level among males in the United States with a correlation coefficient (R) of 0.383 and weighted average of 13.2%, a difference of 7.1%.
Male Poverty Correlation Summary
| Measurement | Immigrants from Bangladesh | Central American |
| Minimum | 0.44% | 2.9% |
| Maximum | 35.7% | 60.5% |
| Range | 35.2% | 57.6% |
| Mean | 13.9% | 15.9% |
| Median | 12.1% | 13.7% |
| Interquartile 25% (IQ1) | 9.7% | 12.0% |
| Interquartile 75% (IQ3) | 16.7% | 17.2% |
| Interquartile Range (IQR) | 7.0% | 5.2% |
| Standard Deviation (Sample) | 7.4% | 8.3% |
| Standard Deviation (Population) | 7.3% | 8.2% |
Similar Demographics by Male Poverty
Demographics Similar to Immigrants from Bangladesh by Male Poverty
In terms of male poverty, the demographic groups most similar to Immigrants from Bangladesh are Creek (14.1%, a difference of 0.070%), Senegalese (14.1%, a difference of 0.21%), Bahamian (14.1%, a difference of 0.32%), Immigrants from Caribbean (14.0%, a difference of 0.36%), and Immigrants from Senegal (14.0%, a difference of 0.42%).
| Demographics | Rating | Rank | Male Poverty |
| Blackfeet | 0.0 /100 | #298 | Tragic 14.0% |
| Immigrants | Guatemala | 0.0 /100 | #299 | Tragic 14.0% |
| Immigrants | Mexico | 0.0 /100 | #300 | Tragic 14.0% |
| Immigrants | Senegal | 0.0 /100 | #301 | Tragic 14.0% |
| Immigrants | Caribbean | 0.0 /100 | #302 | Tragic 14.0% |
| Bahamians | 0.0 /100 | #303 | Tragic 14.1% |
| Senegalese | 0.0 /100 | #304 | Tragic 14.1% |
| Immigrants | Bangladesh | 0.0 /100 | #305 | Tragic 14.1% |
| Creek | 0.0 /100 | #306 | Tragic 14.1% |
| Dutch West Indians | 0.0 /100 | #307 | Tragic 14.2% |
| Africans | 0.0 /100 | #308 | Tragic 14.2% |
| Somalis | 0.0 /100 | #309 | Tragic 14.3% |
| Seminole | 0.0 /100 | #310 | Tragic 14.3% |
| Hondurans | 0.0 /100 | #311 | Tragic 14.3% |
| Choctaw | 0.0 /100 | #312 | Tragic 14.4% |
Demographics Similar to Central Americans by Male Poverty
In terms of male poverty, the demographic groups most similar to Central Americans are Iroquois (13.2%, a difference of 0.36%), Jamaican (13.2%, a difference of 0.38%), Spanish American Indian (13.1%, a difference of 0.40%), Trinidadian and Tobagonian (13.1%, a difference of 0.45%), and Ottawa (13.1%, a difference of 0.47%).
| Demographics | Rating | Rank | Male Poverty |
| Immigrants | Burma/Myanmar | 0.1 /100 | #256 | Tragic 13.0% |
| Immigrants | Trinidad and Tobago | 0.1 /100 | #257 | Tragic 13.1% |
| Cape Verdeans | 0.1 /100 | #258 | Tragic 13.1% |
| Cherokee | 0.1 /100 | #259 | Tragic 13.1% |
| Ottawa | 0.1 /100 | #260 | Tragic 13.1% |
| Trinidadians and Tobagonians | 0.1 /100 | #261 | Tragic 13.1% |
| Spanish American Indians | 0.1 /100 | #262 | Tragic 13.1% |
| Central Americans | 0.1 /100 | #263 | Tragic 13.2% |
| Iroquois | 0.1 /100 | #264 | Tragic 13.2% |
| Jamaicans | 0.1 /100 | #265 | Tragic 13.2% |
| Immigrants | Guyana | 0.1 /100 | #266 | Tragic 13.2% |
| Immigrants | Jamaica | 0.1 /100 | #267 | Tragic 13.3% |
| Sub-Saharan Africans | 0.1 /100 | #268 | Tragic 13.3% |
| Guyanese | 0.0 /100 | #269 | Tragic 13.3% |
| Cree | 0.0 /100 | #270 | Tragic 13.3% |