Immigrants from Bangladesh vs Immigrants from Latin America Male Poverty
COMPARE
Immigrants from Bangladesh
Immigrants from Latin America
Male Poverty
Male Poverty Comparison
Immigrants from Bangladesh
Immigrants from Latin America
14.1%
MALE POVERTY
0.0/ 100
METRIC RATING
305th/ 347
METRIC RANK
13.6%
MALE POVERTY
0.0/ 100
METRIC RATING
276th/ 347
METRIC RANK
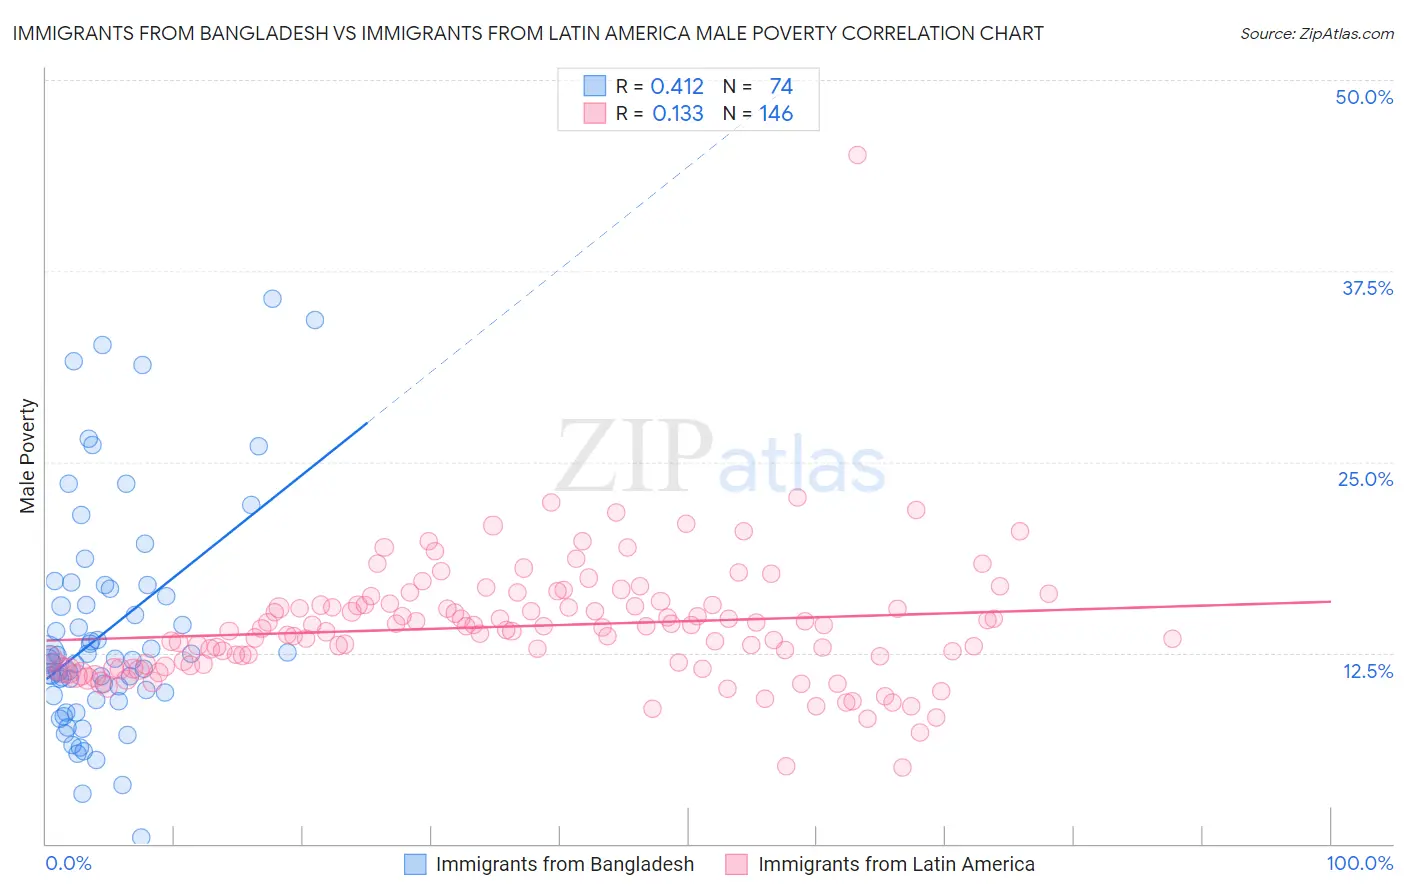
Immigrants from Bangladesh vs Immigrants from Latin America Male Poverty Correlation Chart
The statistical analysis conducted on geographies consisting of 203,544,271 people shows a moderate positive correlation between the proportion of Immigrants from Bangladesh and poverty level among males in the United States with a correlation coefficient (R) of 0.412 and weighted average of 14.1%. Similarly, the statistical analysis conducted on geographies consisting of 557,334,914 people shows a poor positive correlation between the proportion of Immigrants from Latin America and poverty level among males in the United States with a correlation coefficient (R) of 0.133 and weighted average of 13.6%, a difference of 3.6%.
Male Poverty Correlation Summary
| Measurement | Immigrants from Bangladesh | Immigrants from Latin America |
| Minimum | 0.44% | 5.0% |
| Maximum | 35.7% | 45.1% |
| Range | 35.2% | 40.1% |
| Mean | 13.9% | 14.2% |
| Median | 12.1% | 14.1% |
| Interquartile 25% (IQ1) | 9.7% | 11.8% |
| Interquartile 75% (IQ3) | 16.7% | 15.6% |
| Interquartile Range (IQR) | 7.0% | 3.9% |
| Standard Deviation (Sample) | 7.4% | 4.2% |
| Standard Deviation (Population) | 7.3% | 4.2% |
Similar Demographics by Male Poverty
Demographics Similar to Immigrants from Bangladesh by Male Poverty
In terms of male poverty, the demographic groups most similar to Immigrants from Bangladesh are Creek (14.1%, a difference of 0.070%), Senegalese (14.1%, a difference of 0.21%), Bahamian (14.1%, a difference of 0.32%), Immigrants from Caribbean (14.0%, a difference of 0.36%), and Immigrants from Senegal (14.0%, a difference of 0.42%).
| Demographics | Rating | Rank | Male Poverty |
| Blackfeet | 0.0 /100 | #298 | Tragic 14.0% |
| Immigrants | Guatemala | 0.0 /100 | #299 | Tragic 14.0% |
| Immigrants | Mexico | 0.0 /100 | #300 | Tragic 14.0% |
| Immigrants | Senegal | 0.0 /100 | #301 | Tragic 14.0% |
| Immigrants | Caribbean | 0.0 /100 | #302 | Tragic 14.0% |
| Bahamians | 0.0 /100 | #303 | Tragic 14.1% |
| Senegalese | 0.0 /100 | #304 | Tragic 14.1% |
| Immigrants | Bangladesh | 0.0 /100 | #305 | Tragic 14.1% |
| Creek | 0.0 /100 | #306 | Tragic 14.1% |
| Dutch West Indians | 0.0 /100 | #307 | Tragic 14.2% |
| Africans | 0.0 /100 | #308 | Tragic 14.2% |
| Somalis | 0.0 /100 | #309 | Tragic 14.3% |
| Seminole | 0.0 /100 | #310 | Tragic 14.3% |
| Hondurans | 0.0 /100 | #311 | Tragic 14.3% |
| Choctaw | 0.0 /100 | #312 | Tragic 14.4% |
Demographics Similar to Immigrants from Latin America by Male Poverty
In terms of male poverty, the demographic groups most similar to Immigrants from Latin America are Bangladeshi (13.6%, a difference of 0.15%), Barbadian (13.6%, a difference of 0.19%), Belizean (13.6%, a difference of 0.24%), Haitian (13.7%, a difference of 0.42%), and Mexican (13.7%, a difference of 0.52%).
| Demographics | Rating | Rank | Male Poverty |
| Guyanese | 0.0 /100 | #269 | Tragic 13.3% |
| Cree | 0.0 /100 | #270 | Tragic 13.3% |
| Spanish Americans | 0.0 /100 | #271 | Tragic 13.4% |
| Immigrants | Bahamas | 0.0 /100 | #272 | Tragic 13.5% |
| Chickasaw | 0.0 /100 | #273 | Tragic 13.5% |
| Immigrants | West Indies | 0.0 /100 | #274 | Tragic 13.5% |
| Barbadians | 0.0 /100 | #275 | Tragic 13.6% |
| Immigrants | Latin America | 0.0 /100 | #276 | Tragic 13.6% |
| Bangladeshis | 0.0 /100 | #277 | Tragic 13.6% |
| Belizeans | 0.0 /100 | #278 | Tragic 13.6% |
| Haitians | 0.0 /100 | #279 | Tragic 13.7% |
| Mexicans | 0.0 /100 | #280 | Tragic 13.7% |
| Yaqui | 0.0 /100 | #281 | Tragic 13.7% |
| Immigrants | Cabo Verde | 0.0 /100 | #282 | Tragic 13.7% |
| Comanche | 0.0 /100 | #283 | Tragic 13.8% |