Immigrants from Bangladesh vs Bhutanese Male Poverty
COMPARE
Immigrants from Bangladesh
Bhutanese
Male Poverty
Male Poverty Comparison
Immigrants from Bangladesh
Bhutanese
14.1%
MALE POVERTY
0.0/ 100
METRIC RATING
305th/ 347
METRIC RANK
9.5%
MALE POVERTY
99.8/ 100
METRIC RATING
15th/ 347
METRIC RANK
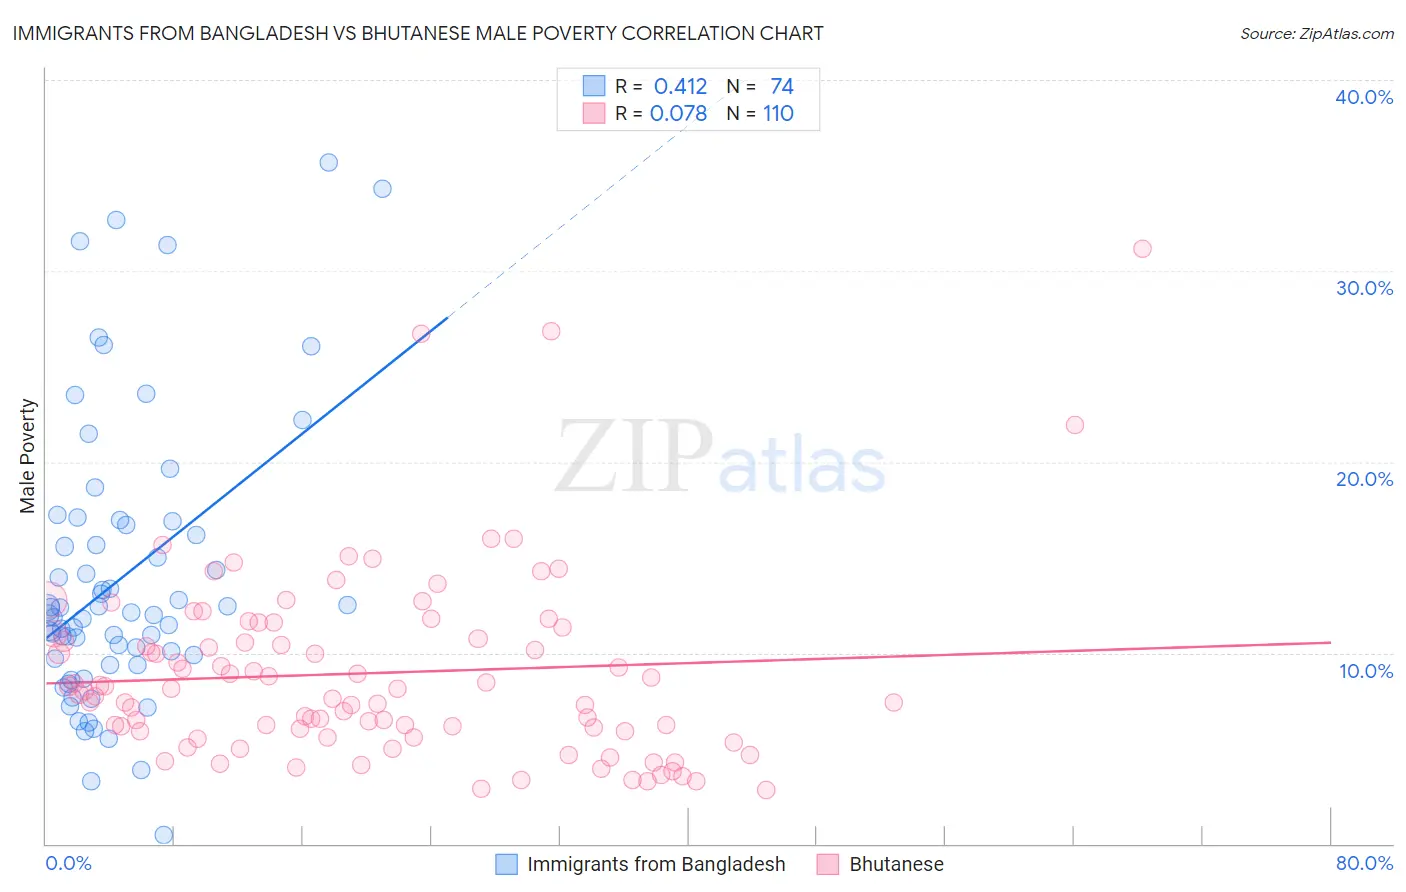
Immigrants from Bangladesh vs Bhutanese Male Poverty Correlation Chart
The statistical analysis conducted on geographies consisting of 203,544,271 people shows a moderate positive correlation between the proportion of Immigrants from Bangladesh and poverty level among males in the United States with a correlation coefficient (R) of 0.412 and weighted average of 14.1%. Similarly, the statistical analysis conducted on geographies consisting of 454,976,396 people shows a slight positive correlation between the proportion of Bhutanese and poverty level among males in the United States with a correlation coefficient (R) of 0.078 and weighted average of 9.5%, a difference of 49.0%.
Male Poverty Correlation Summary
| Measurement | Immigrants from Bangladesh | Bhutanese |
| Minimum | 0.44% | 2.8% |
| Maximum | 35.7% | 31.2% |
| Range | 35.2% | 28.3% |
| Mean | 13.9% | 8.9% |
| Median | 12.1% | 8.0% |
| Interquartile 25% (IQ1) | 9.7% | 5.9% |
| Interquartile 75% (IQ3) | 16.7% | 11.0% |
| Interquartile Range (IQR) | 7.0% | 5.1% |
| Standard Deviation (Sample) | 7.4% | 4.9% |
| Standard Deviation (Population) | 7.3% | 4.8% |
Similar Demographics by Male Poverty
Demographics Similar to Immigrants from Bangladesh by Male Poverty
In terms of male poverty, the demographic groups most similar to Immigrants from Bangladesh are Creek (14.1%, a difference of 0.070%), Senegalese (14.1%, a difference of 0.21%), Bahamian (14.1%, a difference of 0.32%), Immigrants from Caribbean (14.0%, a difference of 0.36%), and Immigrants from Senegal (14.0%, a difference of 0.42%).
| Demographics | Rating | Rank | Male Poverty |
| Blackfeet | 0.0 /100 | #298 | Tragic 14.0% |
| Immigrants | Guatemala | 0.0 /100 | #299 | Tragic 14.0% |
| Immigrants | Mexico | 0.0 /100 | #300 | Tragic 14.0% |
| Immigrants | Senegal | 0.0 /100 | #301 | Tragic 14.0% |
| Immigrants | Caribbean | 0.0 /100 | #302 | Tragic 14.0% |
| Bahamians | 0.0 /100 | #303 | Tragic 14.1% |
| Senegalese | 0.0 /100 | #304 | Tragic 14.1% |
| Immigrants | Bangladesh | 0.0 /100 | #305 | Tragic 14.1% |
| Creek | 0.0 /100 | #306 | Tragic 14.1% |
| Dutch West Indians | 0.0 /100 | #307 | Tragic 14.2% |
| Africans | 0.0 /100 | #308 | Tragic 14.2% |
| Somalis | 0.0 /100 | #309 | Tragic 14.3% |
| Seminole | 0.0 /100 | #310 | Tragic 14.3% |
| Hondurans | 0.0 /100 | #311 | Tragic 14.3% |
| Choctaw | 0.0 /100 | #312 | Tragic 14.4% |
Demographics Similar to Bhutanese by Male Poverty
In terms of male poverty, the demographic groups most similar to Bhutanese are Immigrants from North Macedonia (9.4%, a difference of 0.29%), Luxembourger (9.5%, a difference of 0.52%), Norwegian (9.5%, a difference of 0.65%), Immigrants from Lithuania (9.4%, a difference of 0.67%), and Immigrants from Bolivia (9.4%, a difference of 0.79%).
| Demographics | Rating | Rank | Male Poverty |
| Filipinos | 99.9 /100 | #8 | Exceptional 9.2% |
| Immigrants | South Central Asia | 99.9 /100 | #9 | Exceptional 9.3% |
| Bulgarians | 99.9 /100 | #10 | Exceptional 9.3% |
| Bolivians | 99.9 /100 | #11 | Exceptional 9.4% |
| Immigrants | Bolivia | 99.9 /100 | #12 | Exceptional 9.4% |
| Immigrants | Lithuania | 99.9 /100 | #13 | Exceptional 9.4% |
| Immigrants | North Macedonia | 99.8 /100 | #14 | Exceptional 9.4% |
| Bhutanese | 99.8 /100 | #15 | Exceptional 9.5% |
| Luxembourgers | 99.8 /100 | #16 | Exceptional 9.5% |
| Norwegians | 99.8 /100 | #17 | Exceptional 9.5% |
| Lithuanians | 99.8 /100 | #18 | Exceptional 9.5% |
| Immigrants | Hong Kong | 99.7 /100 | #19 | Exceptional 9.6% |
| Latvians | 99.7 /100 | #20 | Exceptional 9.6% |
| Immigrants | Scotland | 99.7 /100 | #21 | Exceptional 9.6% |
| Croatians | 99.7 /100 | #22 | Exceptional 9.6% |