Immigrants from Bangladesh vs Native/Alaskan Male Poverty
COMPARE
Immigrants from Bangladesh
Native/Alaskan
Male Poverty
Male Poverty Comparison
Immigrants from Bangladesh
Natives/Alaskans
14.1%
MALE POVERTY
0.0/ 100
METRIC RATING
305th/ 347
METRIC RANK
16.9%
MALE POVERTY
0.0/ 100
METRIC RATING
333rd/ 347
METRIC RANK
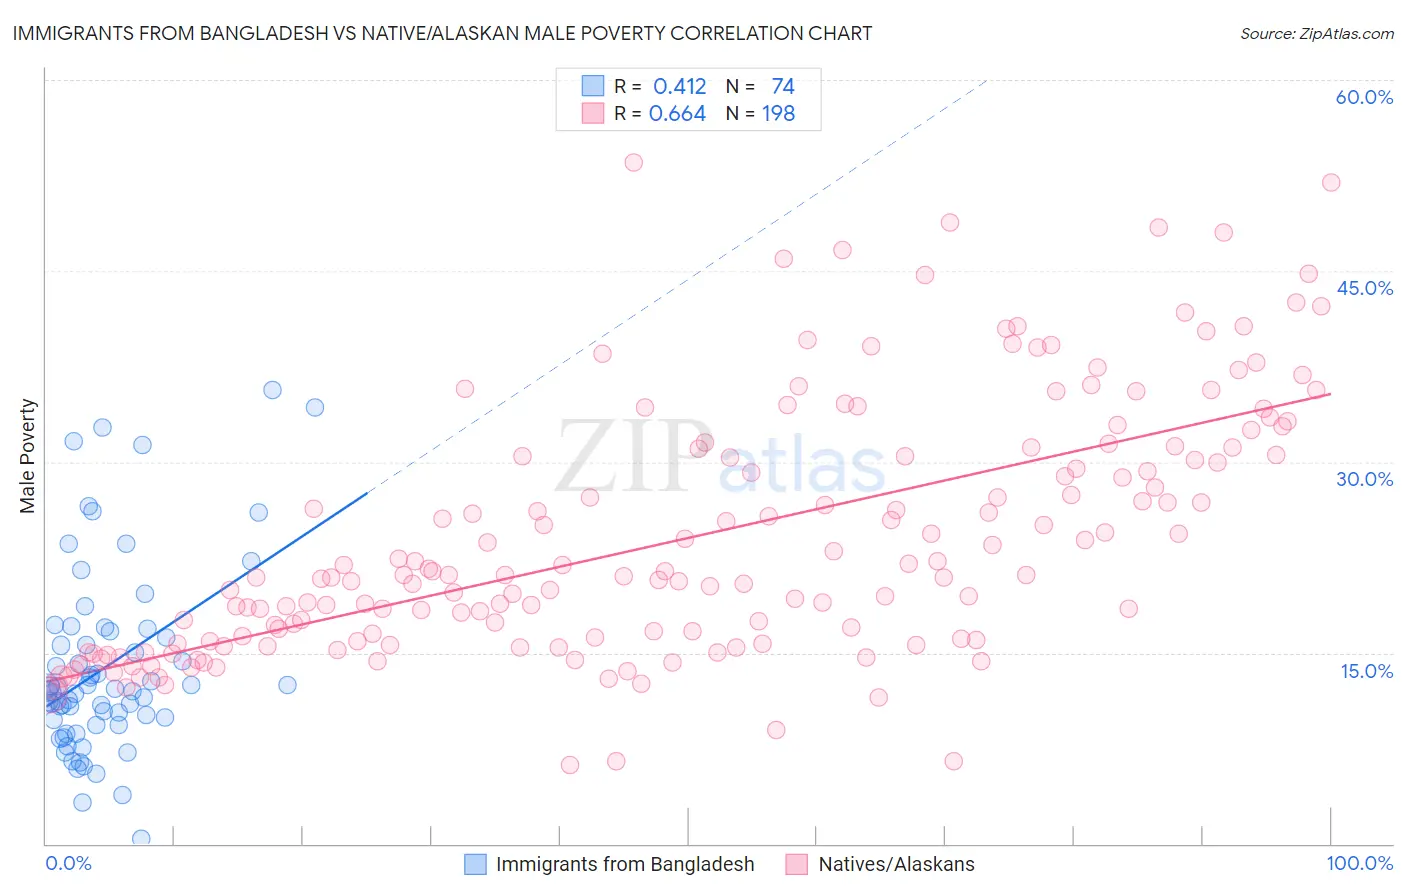
Immigrants from Bangladesh vs Native/Alaskan Male Poverty Correlation Chart
The statistical analysis conducted on geographies consisting of 203,544,271 people shows a moderate positive correlation between the proportion of Immigrants from Bangladesh and poverty level among males in the United States with a correlation coefficient (R) of 0.412 and weighted average of 14.1%. Similarly, the statistical analysis conducted on geographies consisting of 512,413,000 people shows a significant positive correlation between the proportion of Natives/Alaskans and poverty level among males in the United States with a correlation coefficient (R) of 0.664 and weighted average of 16.9%, a difference of 20.1%.
Male Poverty Correlation Summary
| Measurement | Immigrants from Bangladesh | Native/Alaskan |
| Minimum | 0.44% | 6.2% |
| Maximum | 35.7% | 53.5% |
| Range | 35.2% | 47.3% |
| Mean | 13.9% | 24.0% |
| Median | 12.1% | 21.1% |
| Interquartile 25% (IQ1) | 9.7% | 16.0% |
| Interquartile 75% (IQ3) | 16.7% | 30.5% |
| Interquartile Range (IQR) | 7.0% | 14.6% |
| Standard Deviation (Sample) | 7.4% | 9.9% |
| Standard Deviation (Population) | 7.3% | 9.9% |
Similar Demographics by Male Poverty
Demographics Similar to Immigrants from Bangladesh by Male Poverty
In terms of male poverty, the demographic groups most similar to Immigrants from Bangladesh are Creek (14.1%, a difference of 0.070%), Senegalese (14.1%, a difference of 0.21%), Bahamian (14.1%, a difference of 0.32%), Immigrants from Caribbean (14.0%, a difference of 0.36%), and Immigrants from Senegal (14.0%, a difference of 0.42%).
| Demographics | Rating | Rank | Male Poverty |
| Blackfeet | 0.0 /100 | #298 | Tragic 14.0% |
| Immigrants | Guatemala | 0.0 /100 | #299 | Tragic 14.0% |
| Immigrants | Mexico | 0.0 /100 | #300 | Tragic 14.0% |
| Immigrants | Senegal | 0.0 /100 | #301 | Tragic 14.0% |
| Immigrants | Caribbean | 0.0 /100 | #302 | Tragic 14.0% |
| Bahamians | 0.0 /100 | #303 | Tragic 14.1% |
| Senegalese | 0.0 /100 | #304 | Tragic 14.1% |
| Immigrants | Bangladesh | 0.0 /100 | #305 | Tragic 14.1% |
| Creek | 0.0 /100 | #306 | Tragic 14.1% |
| Dutch West Indians | 0.0 /100 | #307 | Tragic 14.2% |
| Africans | 0.0 /100 | #308 | Tragic 14.2% |
| Somalis | 0.0 /100 | #309 | Tragic 14.3% |
| Seminole | 0.0 /100 | #310 | Tragic 14.3% |
| Hondurans | 0.0 /100 | #311 | Tragic 14.3% |
| Choctaw | 0.0 /100 | #312 | Tragic 14.4% |
Demographics Similar to Natives/Alaskans by Male Poverty
In terms of male poverty, the demographic groups most similar to Natives/Alaskans are Houma (16.7%, a difference of 1.2%), Cheyenne (17.6%, a difference of 4.2%), Ute (16.2%, a difference of 4.2%), Apache (17.7%, a difference of 4.4%), and Immigrants from Dominican Republic (16.2%, a difference of 4.6%).
| Demographics | Rating | Rank | Male Poverty |
| Central American Indians | 0.0 /100 | #326 | Tragic 15.3% |
| Paiute | 0.0 /100 | #327 | Tragic 15.8% |
| Blacks/African Americans | 0.0 /100 | #328 | Tragic 15.8% |
| Dominicans | 0.0 /100 | #329 | Tragic 16.1% |
| Immigrants | Dominican Republic | 0.0 /100 | #330 | Tragic 16.2% |
| Ute | 0.0 /100 | #331 | Tragic 16.2% |
| Houma | 0.0 /100 | #332 | Tragic 16.7% |
| Natives/Alaskans | 0.0 /100 | #333 | Tragic 16.9% |
| Cheyenne | 0.0 /100 | #334 | Tragic 17.6% |
| Apache | 0.0 /100 | #335 | Tragic 17.7% |
| Pueblo | 0.0 /100 | #336 | Tragic 18.5% |
| Sioux | 0.0 /100 | #337 | Tragic 18.7% |
| Crow | 0.0 /100 | #338 | Tragic 19.1% |
| Yuman | 0.0 /100 | #339 | Tragic 19.5% |
| Immigrants | Yemen | 0.0 /100 | #340 | Tragic 20.1% |