Immigrants from Armenia vs Salvadoran In Labor Force | Age 45-54
COMPARE
Immigrants from Armenia
Salvadoran
In Labor Force | Age 45-54
In Labor Force | Age 45-54 Comparison
Immigrants from Armenia
Salvadorans
81.7%
IN LABOR FORCE | AGE 45-54
0.2/ 100
METRIC RATING
250th/ 347
METRIC RANK
82.0%
IN LABOR FORCE | AGE 45-54
1.7/ 100
METRIC RATING
234th/ 347
METRIC RANK
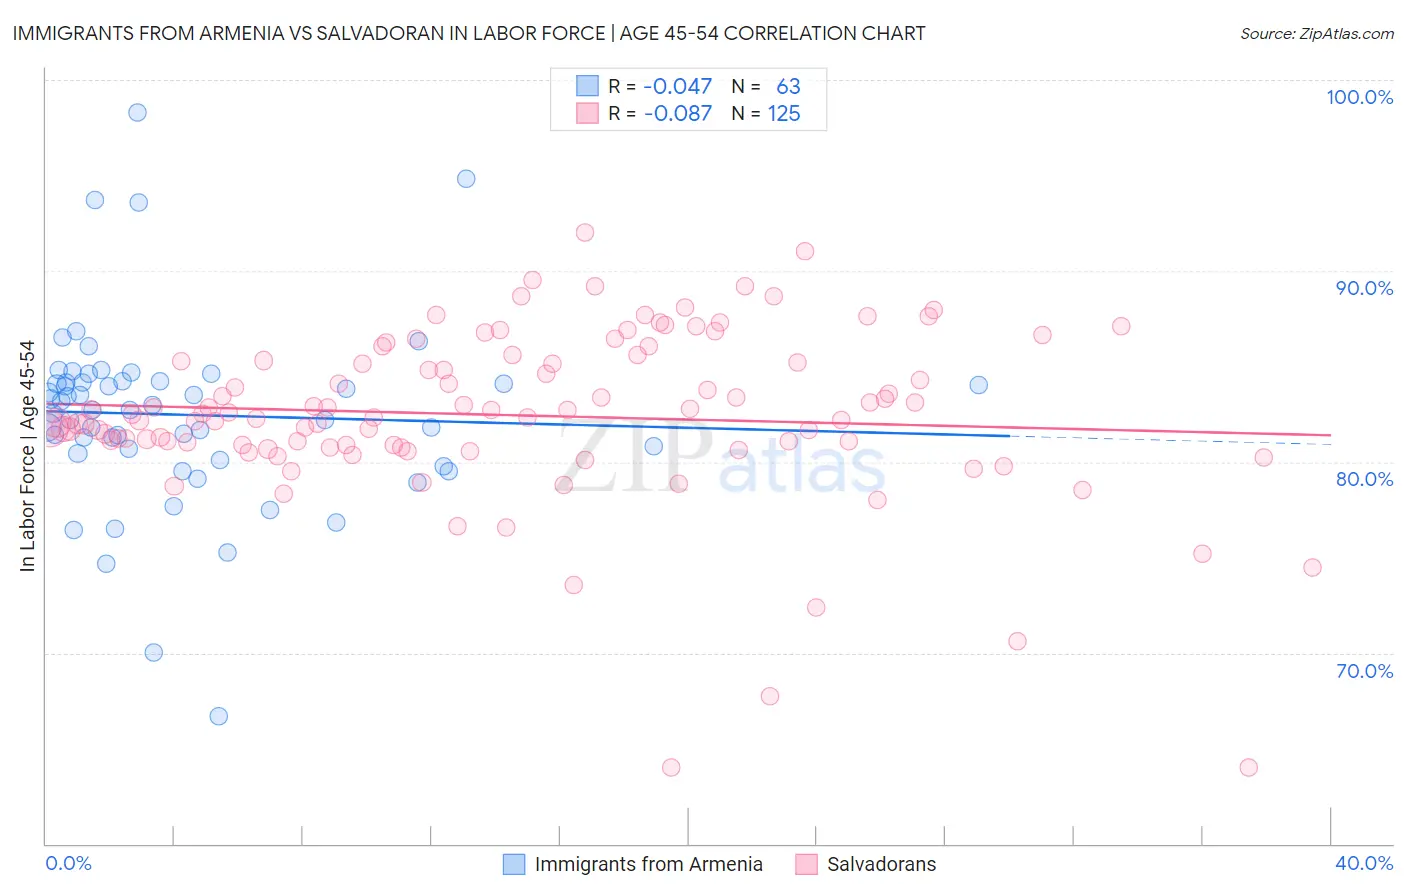
Immigrants from Armenia vs Salvadoran In Labor Force | Age 45-54 Correlation Chart
The statistical analysis conducted on geographies consisting of 97,712,930 people shows no correlation between the proportion of Immigrants from Armenia and labor force participation rate among population between the ages 45 and 54 in the United States with a correlation coefficient (R) of -0.047 and weighted average of 81.7%. Similarly, the statistical analysis conducted on geographies consisting of 398,682,111 people shows a slight negative correlation between the proportion of Salvadorans and labor force participation rate among population between the ages 45 and 54 in the United States with a correlation coefficient (R) of -0.087 and weighted average of 82.0%, a difference of 0.43%.
In Labor Force | Age 45-54 Correlation Summary
| Measurement | Immigrants from Armenia | Salvadoran |
| Minimum | 66.7% | 64.0% |
| Maximum | 98.3% | 92.0% |
| Range | 31.6% | 28.0% |
| Mean | 82.5% | 82.4% |
| Median | 82.7% | 82.4% |
| Interquartile 25% (IQ1) | 80.4% | 80.8% |
| Interquartile 75% (IQ3) | 84.2% | 85.3% |
| Interquartile Range (IQR) | 3.8% | 4.5% |
| Standard Deviation (Sample) | 4.9% | 4.5% |
| Standard Deviation (Population) | 4.9% | 4.5% |
Demographics Similar to Immigrants from Armenia and Salvadorans by In Labor Force | Age 45-54
In terms of in labor force | age 45-54, the demographic groups most similar to Immigrants from Armenia are Guamanian/Chamorro (81.6%, a difference of 0.020%), Pennsylvania German (81.6%, a difference of 0.040%), Hmong (81.7%, a difference of 0.050%), Puget Sound Salish (81.7%, a difference of 0.070%), and Central American (81.7%, a difference of 0.090%). Similarly, the demographic groups most similar to Salvadorans are Immigrants from Portugal (82.0%, a difference of 0.0%), Malaysian (82.0%, a difference of 0.0%), Subsaharan African (82.0%, a difference of 0.070%), Basque (82.0%, a difference of 0.070%), and Immigrants from Trinidad and Tobago (82.0%, a difference of 0.080%).
| Demographics | Rating | Rank | In Labor Force | Age 45-54 |
| Immigrants | Portugal | 1.7 /100 | #232 | Tragic 82.0% |
| Malaysians | 1.7 /100 | #233 | Tragic 82.0% |
| Salvadorans | 1.7 /100 | #234 | Tragic 82.0% |
| Sub-Saharan Africans | 1.2 /100 | #235 | Tragic 82.0% |
| Basques | 1.2 /100 | #236 | Tragic 82.0% |
| Immigrants | Trinidad and Tobago | 1.2 /100 | #237 | Tragic 82.0% |
| Trinidadians and Tobagonians | 1.1 /100 | #238 | Tragic 81.9% |
| Immigrants | Thailand | 1.0 /100 | #239 | Tragic 81.9% |
| Immigrants | El Salvador | 1.0 /100 | #240 | Tragic 81.9% |
| Immigrants | Cambodia | 0.8 /100 | #241 | Tragic 81.9% |
| Whites/Caucasians | 0.7 /100 | #242 | Tragic 81.9% |
| Samoans | 0.6 /100 | #243 | Tragic 81.8% |
| Celtics | 0.4 /100 | #244 | Tragic 81.8% |
| Alaska Natives | 0.4 /100 | #245 | Tragic 81.8% |
| Alaskan Athabascans | 0.4 /100 | #246 | Tragic 81.8% |
| Central Americans | 0.4 /100 | #247 | Tragic 81.7% |
| Puget Sound Salish | 0.3 /100 | #248 | Tragic 81.7% |
| Hmong | 0.3 /100 | #249 | Tragic 81.7% |
| Immigrants | Armenia | 0.2 /100 | #250 | Tragic 81.7% |
| Guamanians/Chamorros | 0.2 /100 | #251 | Tragic 81.6% |
| Pennsylvania Germans | 0.2 /100 | #252 | Tragic 81.6% |