Icelander vs Immigrants from Latvia Bachelor's Degree
COMPARE
Icelander
Immigrants from Latvia
Bachelor's Degree
Bachelor's Degree Comparison
Icelanders
Immigrants from Latvia
39.5%
BACHELOR'S DEGREE
86.5/ 100
METRIC RATING
137th/ 347
METRIC RANK
45.1%
BACHELOR'S DEGREE
100.0/ 100
METRIC RATING
39th/ 347
METRIC RANK
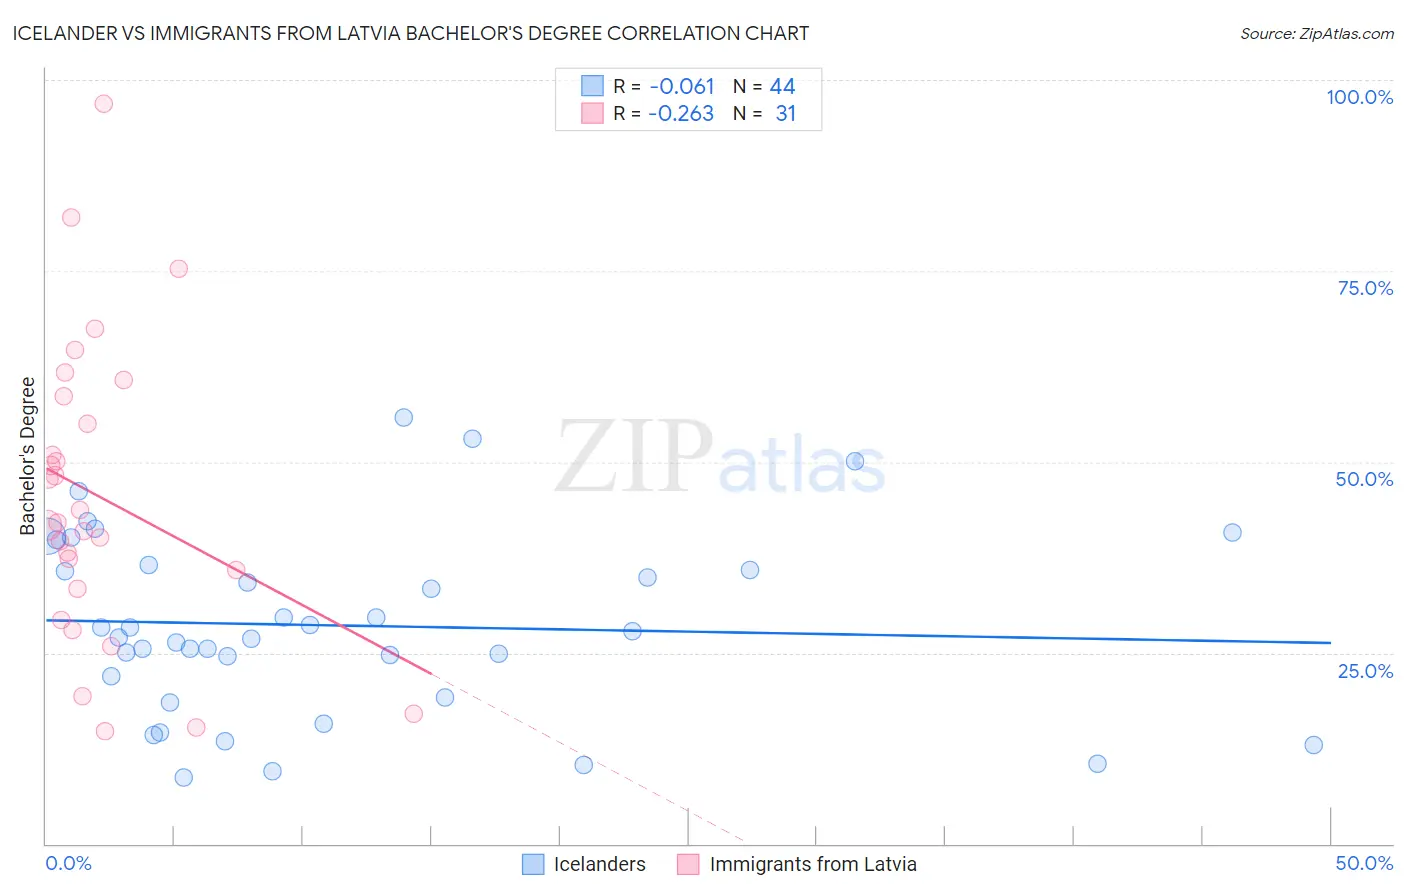
Icelander vs Immigrants from Latvia Bachelor's Degree Correlation Chart
The statistical analysis conducted on geographies consisting of 159,661,009 people shows a slight negative correlation between the proportion of Icelanders and percentage of population with at least bachelor's degree education in the United States with a correlation coefficient (R) of -0.061 and weighted average of 39.5%. Similarly, the statistical analysis conducted on geographies consisting of 113,735,345 people shows a weak negative correlation between the proportion of Immigrants from Latvia and percentage of population with at least bachelor's degree education in the United States with a correlation coefficient (R) of -0.263 and weighted average of 45.1%, a difference of 14.2%.
Bachelor's Degree Correlation Summary
| Measurement | Icelander | Immigrants from Latvia |
| Minimum | 8.8% | 14.7% |
| Maximum | 55.7% | 96.9% |
| Range | 47.0% | 82.2% |
| Mean | 28.6% | 45.5% |
| Median | 27.4% | 42.0% |
| Interquartile 25% (IQ1) | 20.6% | 33.3% |
| Interquartile 75% (IQ3) | 36.1% | 58.6% |
| Interquartile Range (IQR) | 15.5% | 25.3% |
| Standard Deviation (Sample) | 11.9% | 19.4% |
| Standard Deviation (Population) | 11.7% | 19.1% |
Similar Demographics by Bachelor's Degree
Demographics Similar to Icelanders by Bachelor's Degree
In terms of bachelor's degree, the demographic groups most similar to Icelanders are European (39.5%, a difference of 0.17%), Pakistani (39.7%, a difference of 0.37%), Immigrants from Sudan (39.4%, a difference of 0.37%), Immigrants from Armenia (39.4%, a difference of 0.44%), and South American Indian (39.3%, a difference of 0.53%).
| Demographics | Rating | Rank | Bachelor's Degree |
| Sierra Leoneans | 92.2 /100 | #130 | Exceptional 40.1% |
| Italians | 91.9 /100 | #131 | Exceptional 40.1% |
| Taiwanese | 91.1 /100 | #132 | Exceptional 40.0% |
| Immigrants | Southern Europe | 91.1 /100 | #133 | Exceptional 40.0% |
| Assyrians/Chaldeans/Syriacs | 89.4 /100 | #134 | Excellent 39.8% |
| Luxembourgers | 89.1 /100 | #135 | Excellent 39.8% |
| Pakistanis | 88.2 /100 | #136 | Excellent 39.7% |
| Icelanders | 86.5 /100 | #137 | Excellent 39.5% |
| Europeans | 85.6 /100 | #138 | Excellent 39.5% |
| Immigrants | Sudan | 84.5 /100 | #139 | Excellent 39.4% |
| Immigrants | Armenia | 84.1 /100 | #140 | Excellent 39.4% |
| South American Indians | 83.6 /100 | #141 | Excellent 39.3% |
| Immigrants | North Macedonia | 81.6 /100 | #142 | Excellent 39.2% |
| Poles | 79.8 /100 | #143 | Good 39.1% |
| Immigrants | Afghanistan | 79.7 /100 | #144 | Good 39.1% |
Demographics Similar to Immigrants from Latvia by Bachelor's Degree
In terms of bachelor's degree, the demographic groups most similar to Immigrants from Latvia are Immigrants from Belarus (45.0%, a difference of 0.27%), Immigrants from Malaysia (45.0%, a difference of 0.31%), Bulgarian (45.3%, a difference of 0.33%), Russian (45.3%, a difference of 0.42%), and Mongolian (45.4%, a difference of 0.57%).
| Demographics | Rating | Rank | Bachelor's Degree |
| Immigrants | Turkey | 100.0 /100 | #32 | Exceptional 46.0% |
| Immigrants | Northern Europe | 100.0 /100 | #33 | Exceptional 45.6% |
| Immigrants | Denmark | 100.0 /100 | #34 | Exceptional 45.4% |
| Immigrants | Russia | 100.0 /100 | #35 | Exceptional 45.4% |
| Mongolians | 100.0 /100 | #36 | Exceptional 45.4% |
| Russians | 100.0 /100 | #37 | Exceptional 45.3% |
| Bulgarians | 100.0 /100 | #38 | Exceptional 45.3% |
| Immigrants | Latvia | 100.0 /100 | #39 | Exceptional 45.1% |
| Immigrants | Belarus | 100.0 /100 | #40 | Exceptional 45.0% |
| Immigrants | Malaysia | 100.0 /100 | #41 | Exceptional 45.0% |
| Immigrants | Saudi Arabia | 100.0 /100 | #42 | Exceptional 44.8% |
| Immigrants | South Africa | 99.9 /100 | #43 | Exceptional 44.8% |
| Immigrants | Lithuania | 99.9 /100 | #44 | Exceptional 44.6% |
| Immigrants | Kuwait | 99.9 /100 | #45 | Exceptional 44.6% |
| Immigrants | Bulgaria | 99.9 /100 | #46 | Exceptional 44.6% |