Cherokee vs Immigrants from Latvia Single Male Poverty
COMPARE
Cherokee
Immigrants from Latvia
Single Male Poverty
Single Male Poverty Comparison
Cherokee
Immigrants from Latvia
16.1%
SINGLE MALE POVERTY
0.0/ 100
METRIC RATING
313th/ 347
METRIC RANK
12.2%
SINGLE MALE POVERTY
97.0/ 100
METRIC RATING
101st/ 347
METRIC RANK
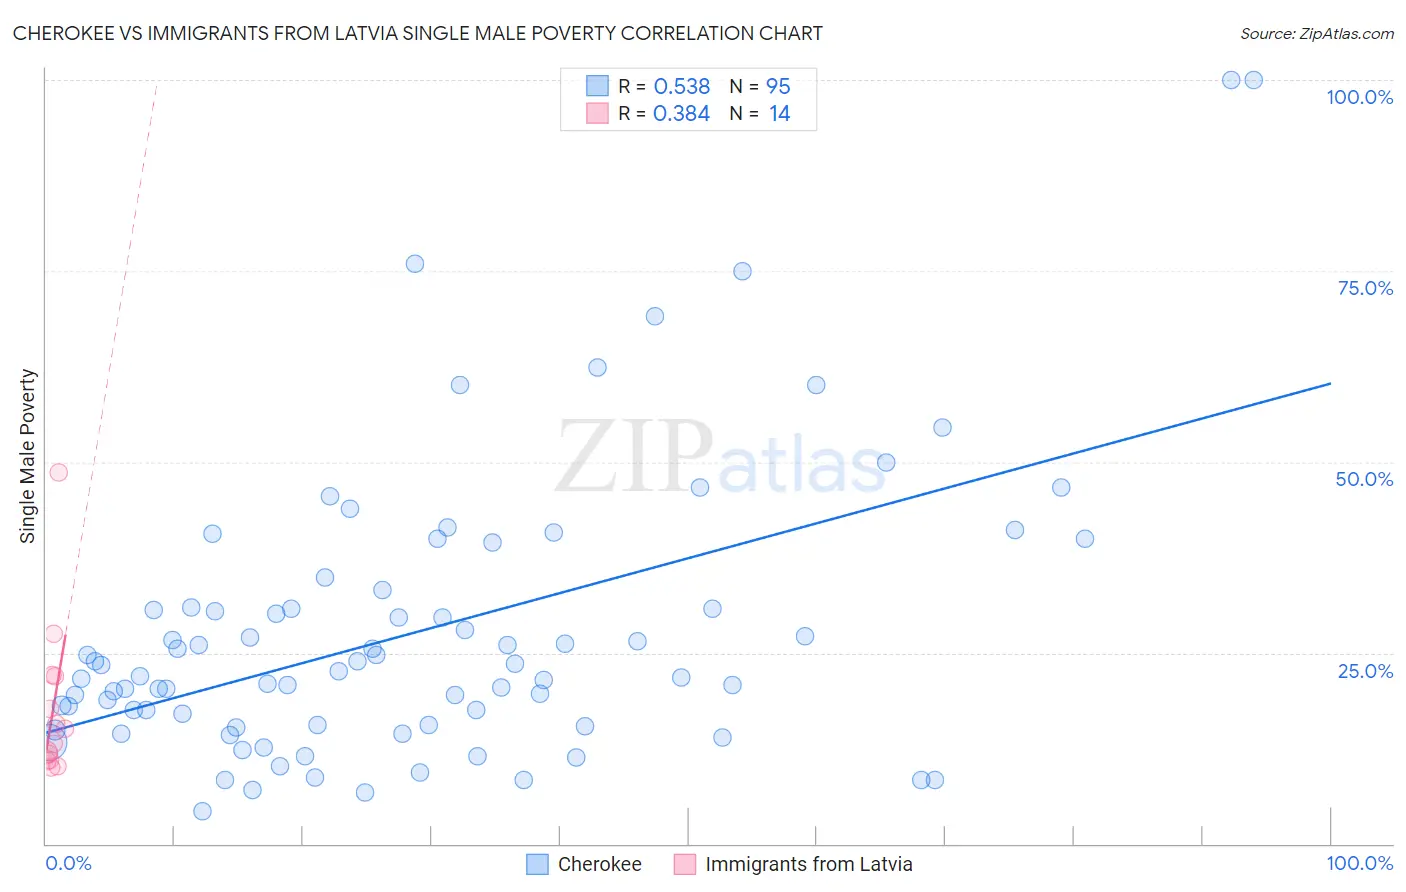
Cherokee vs Immigrants from Latvia Single Male Poverty Correlation Chart
The statistical analysis conducted on geographies consisting of 428,758,235 people shows a substantial positive correlation between the proportion of Cherokee and poverty level among single males in the United States with a correlation coefficient (R) of 0.538 and weighted average of 16.1%. Similarly, the statistical analysis conducted on geographies consisting of 106,119,330 people shows a mild positive correlation between the proportion of Immigrants from Latvia and poverty level among single males in the United States with a correlation coefficient (R) of 0.384 and weighted average of 12.2%, a difference of 31.5%.
Single Male Poverty Correlation Summary
| Measurement | Cherokee | Immigrants from Latvia |
| Minimum | 4.3% | 9.9% |
| Maximum | 100.0% | 48.6% |
| Range | 95.7% | 38.7% |
| Mean | 27.7% | 17.7% |
| Median | 22.6% | 14.1% |
| Interquartile 25% (IQ1) | 15.5% | 11.0% |
| Interquartile 75% (IQ3) | 30.9% | 22.0% |
| Interquartile Range (IQR) | 15.4% | 11.0% |
| Standard Deviation (Sample) | 18.5% | 10.4% |
| Standard Deviation (Population) | 18.4% | 10.0% |
Similar Demographics by Single Male Poverty
Demographics Similar to Cherokee by Single Male Poverty
In terms of single male poverty, the demographic groups most similar to Cherokee are Seminole (16.0%, a difference of 0.23%), Comanche (16.0%, a difference of 0.23%), Alaskan Athabascan (16.1%, a difference of 0.29%), Cheyenne (16.1%, a difference of 0.33%), and Dutch West Indian (16.1%, a difference of 0.48%).
| Demographics | Rating | Rank | Single Male Poverty |
| Pennsylvania Germans | 0.0 /100 | #306 | Tragic 15.6% |
| Ute | 0.0 /100 | #307 | Tragic 15.7% |
| Potawatomi | 0.0 /100 | #308 | Tragic 15.8% |
| Americans | 0.0 /100 | #309 | Tragic 15.8% |
| Yakama | 0.0 /100 | #310 | Tragic 15.9% |
| Seminole | 0.0 /100 | #311 | Tragic 16.0% |
| Comanche | 0.0 /100 | #312 | Tragic 16.0% |
| Cherokee | 0.0 /100 | #313 | Tragic 16.1% |
| Alaskan Athabascans | 0.0 /100 | #314 | Tragic 16.1% |
| Cheyenne | 0.0 /100 | #315 | Tragic 16.1% |
| Dutch West Indians | 0.0 /100 | #316 | Tragic 16.1% |
| Blacks/African Americans | 0.0 /100 | #317 | Tragic 16.2% |
| Chickasaw | 0.0 /100 | #318 | Tragic 16.3% |
| Chippewa | 0.0 /100 | #319 | Tragic 16.4% |
| Marshallese | 0.0 /100 | #320 | Tragic 16.4% |
Demographics Similar to Immigrants from Latvia by Single Male Poverty
In terms of single male poverty, the demographic groups most similar to Immigrants from Latvia are Immigrants from Europe (12.2%, a difference of 0.010%), Immigrants from Australia (12.2%, a difference of 0.030%), Immigrants from Cuba (12.2%, a difference of 0.15%), Immigrants from Armenia (12.2%, a difference of 0.15%), and Immigrants from Kazakhstan (12.2%, a difference of 0.15%).
| Demographics | Rating | Rank | Single Male Poverty |
| Colombians | 97.8 /100 | #94 | Exceptional 12.2% |
| Mongolians | 97.7 /100 | #95 | Exceptional 12.2% |
| Immigrants | Sweden | 97.5 /100 | #96 | Exceptional 12.2% |
| Immigrants | Italy | 97.4 /100 | #97 | Exceptional 12.2% |
| Guamanians/Chamorros | 97.4 /100 | #98 | Exceptional 12.2% |
| Immigrants | Cuba | 97.3 /100 | #99 | Exceptional 12.2% |
| Immigrants | Australia | 97.1 /100 | #100 | Exceptional 12.2% |
| Immigrants | Latvia | 97.0 /100 | #101 | Exceptional 12.2% |
| Immigrants | Europe | 97.0 /100 | #102 | Exceptional 12.2% |
| Immigrants | Armenia | 96.7 /100 | #103 | Exceptional 12.2% |
| Immigrants | Kazakhstan | 96.7 /100 | #104 | Exceptional 12.2% |
| Jordanians | 95.9 /100 | #105 | Exceptional 12.3% |
| Immigrants | Morocco | 95.6 /100 | #106 | Exceptional 12.3% |
| Iraqis | 95.1 /100 | #107 | Exceptional 12.3% |
| Immigrants | Eastern Africa | 95.0 /100 | #108 | Exceptional 12.3% |