Zimbabwean vs Immigrants from Latvia Single Male Poverty
COMPARE
Zimbabwean
Immigrants from Latvia
Single Male Poverty
Single Male Poverty Comparison
Zimbabweans
Immigrants from Latvia
13.1%
SINGLE MALE POVERTY
14.9/ 100
METRIC RATING
214th/ 347
METRIC RANK
12.2%
SINGLE MALE POVERTY
97.0/ 100
METRIC RATING
101st/ 347
METRIC RANK
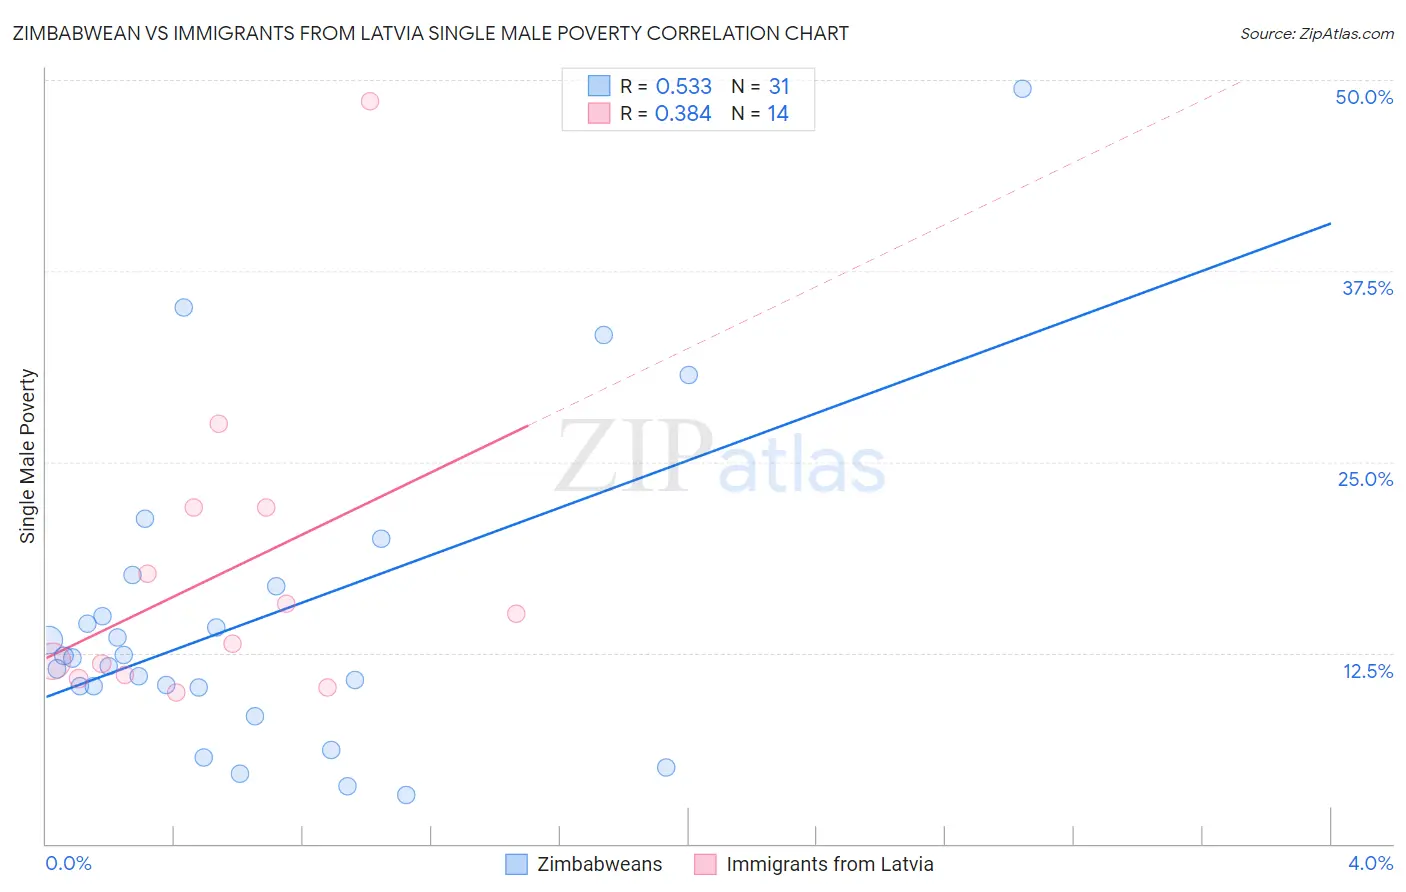
Zimbabwean vs Immigrants from Latvia Single Male Poverty Correlation Chart
The statistical analysis conducted on geographies consisting of 66,821,414 people shows a substantial positive correlation between the proportion of Zimbabweans and poverty level among single males in the United States with a correlation coefficient (R) of 0.533 and weighted average of 13.1%. Similarly, the statistical analysis conducted on geographies consisting of 106,119,330 people shows a mild positive correlation between the proportion of Immigrants from Latvia and poverty level among single males in the United States with a correlation coefficient (R) of 0.384 and weighted average of 12.2%, a difference of 7.2%.
Single Male Poverty Correlation Summary
| Measurement | Zimbabwean | Immigrants from Latvia |
| Minimum | 3.2% | 9.9% |
| Maximum | 49.4% | 48.6% |
| Range | 46.2% | 38.7% |
| Mean | 14.7% | 17.7% |
| Median | 12.2% | 14.1% |
| Interquartile 25% (IQ1) | 10.2% | 11.0% |
| Interquartile 75% (IQ3) | 16.9% | 22.0% |
| Interquartile Range (IQR) | 6.7% | 11.0% |
| Standard Deviation (Sample) | 10.2% | 10.4% |
| Standard Deviation (Population) | 10.0% | 10.0% |
Similar Demographics by Single Male Poverty
Demographics Similar to Zimbabweans by Single Male Poverty
In terms of single male poverty, the demographic groups most similar to Zimbabweans are Japanese (13.1%, a difference of 0.010%), Italian (13.1%, a difference of 0.090%), Austrian (13.1%, a difference of 0.10%), Senegalese (13.1%, a difference of 0.15%), and Swedish (13.1%, a difference of 0.18%).
| Demographics | Rating | Rank | Single Male Poverty |
| Sudanese | 17.7 /100 | #207 | Poor 13.1% |
| Immigrants | Western Africa | 17.6 /100 | #208 | Poor 13.1% |
| Mexican American Indians | 17.5 /100 | #209 | Poor 13.1% |
| Immigrants | Haiti | 16.8 /100 | #210 | Poor 13.1% |
| Swedes | 16.8 /100 | #211 | Poor 13.1% |
| Senegalese | 16.4 /100 | #212 | Poor 13.1% |
| Italians | 15.9 /100 | #213 | Poor 13.1% |
| Zimbabweans | 14.9 /100 | #214 | Poor 13.1% |
| Japanese | 14.8 /100 | #215 | Poor 13.1% |
| Austrians | 13.9 /100 | #216 | Poor 13.1% |
| Bermudans | 13.0 /100 | #217 | Poor 13.1% |
| Scandinavians | 12.9 /100 | #218 | Poor 13.1% |
| Immigrants | Burma/Myanmar | 12.6 /100 | #219 | Poor 13.1% |
| Central Americans | 10.9 /100 | #220 | Poor 13.2% |
| New Zealanders | 10.7 /100 | #221 | Poor 13.2% |
Demographics Similar to Immigrants from Latvia by Single Male Poverty
In terms of single male poverty, the demographic groups most similar to Immigrants from Latvia are Immigrants from Europe (12.2%, a difference of 0.010%), Immigrants from Australia (12.2%, a difference of 0.030%), Immigrants from Cuba (12.2%, a difference of 0.15%), Immigrants from Armenia (12.2%, a difference of 0.15%), and Immigrants from Kazakhstan (12.2%, a difference of 0.15%).
| Demographics | Rating | Rank | Single Male Poverty |
| Colombians | 97.8 /100 | #94 | Exceptional 12.2% |
| Mongolians | 97.7 /100 | #95 | Exceptional 12.2% |
| Immigrants | Sweden | 97.5 /100 | #96 | Exceptional 12.2% |
| Immigrants | Italy | 97.4 /100 | #97 | Exceptional 12.2% |
| Guamanians/Chamorros | 97.4 /100 | #98 | Exceptional 12.2% |
| Immigrants | Cuba | 97.3 /100 | #99 | Exceptional 12.2% |
| Immigrants | Australia | 97.1 /100 | #100 | Exceptional 12.2% |
| Immigrants | Latvia | 97.0 /100 | #101 | Exceptional 12.2% |
| Immigrants | Europe | 97.0 /100 | #102 | Exceptional 12.2% |
| Immigrants | Armenia | 96.7 /100 | #103 | Exceptional 12.2% |
| Immigrants | Kazakhstan | 96.7 /100 | #104 | Exceptional 12.2% |
| Jordanians | 95.9 /100 | #105 | Exceptional 12.3% |
| Immigrants | Morocco | 95.6 /100 | #106 | Exceptional 12.3% |
| Iraqis | 95.1 /100 | #107 | Exceptional 12.3% |
| Immigrants | Eastern Africa | 95.0 /100 | #108 | Exceptional 12.3% |