Hmong vs Samoan Female Poverty
COMPARE
Hmong
Samoan
Female Poverty
Female Poverty Comparison
Hmong
Samoans
13.9%
FEMALE POVERTY
21.1/ 100
METRIC RATING
202nd/ 347
METRIC RANK
13.1%
FEMALE POVERTY
73.6/ 100
METRIC RATING
152nd/ 347
METRIC RANK
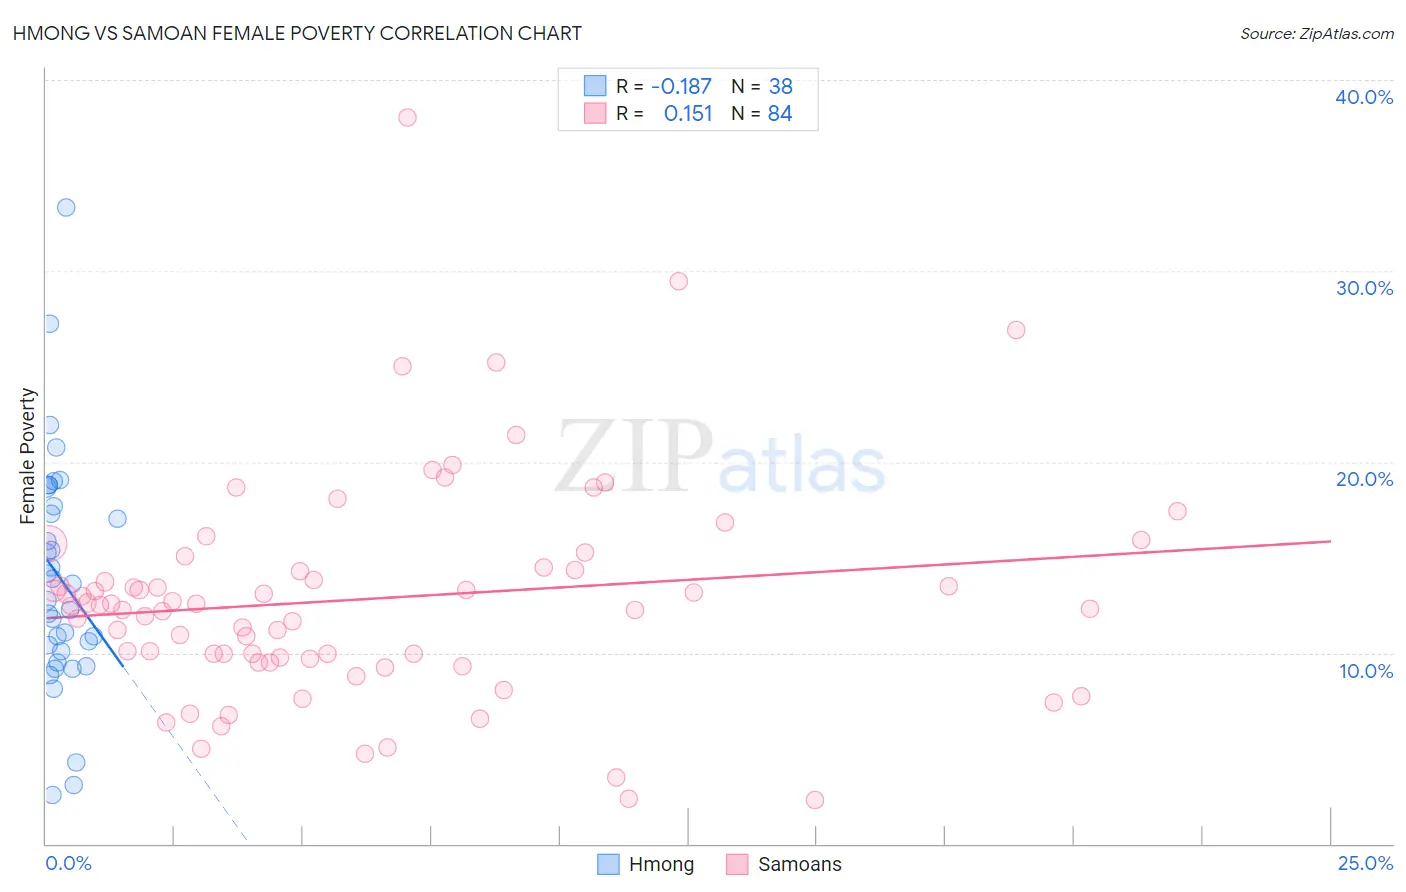
Hmong vs Samoan Female Poverty Correlation Chart
The statistical analysis conducted on geographies consisting of 24,669,739 people shows a poor negative correlation between the proportion of Hmong and poverty level among females in the United States with a correlation coefficient (R) of -0.187 and weighted average of 13.9%. Similarly, the statistical analysis conducted on geographies consisting of 225,052,897 people shows a poor positive correlation between the proportion of Samoans and poverty level among females in the United States with a correlation coefficient (R) of 0.151 and weighted average of 13.1%, a difference of 5.8%.
Female Poverty Correlation Summary
| Measurement | Hmong | Samoan |
| Minimum | 2.5% | 2.3% |
| Maximum | 33.3% | 38.0% |
| Range | 30.8% | 35.7% |
| Mean | 13.9% | 12.8% |
| Median | 13.2% | 12.5% |
| Interquartile 25% (IQ1) | 10.1% | 9.7% |
| Interquartile 75% (IQ3) | 17.7% | 14.4% |
| Interquartile Range (IQR) | 7.6% | 4.7% |
| Standard Deviation (Sample) | 6.1% | 5.8% |
| Standard Deviation (Population) | 6.1% | 5.8% |
Similar Demographics by Female Poverty
Demographics Similar to Hmong by Female Poverty
In terms of female poverty, the demographic groups most similar to Hmong are Immigrants from Kenya (13.9%, a difference of 0.010%), Spanish (13.9%, a difference of 0.050%), Immigrants from Western Asia (13.9%, a difference of 0.050%), Spaniard (13.9%, a difference of 0.32%), and Immigrants from Lebanon (13.8%, a difference of 0.60%).
| Demographics | Rating | Rank | Female Poverty |
| Immigrants | South America | 30.6 /100 | #195 | Fair 13.7% |
| South American Indians | 28.9 /100 | #196 | Fair 13.7% |
| Arabs | 28.6 /100 | #197 | Fair 13.7% |
| Immigrants | Uganda | 28.5 /100 | #198 | Fair 13.7% |
| Immigrants | Lebanon | 25.6 /100 | #199 | Fair 13.8% |
| Spanish | 21.4 /100 | #200 | Fair 13.9% |
| Immigrants | Kenya | 21.1 /100 | #201 | Fair 13.9% |
| Hmong | 21.1 /100 | #202 | Fair 13.9% |
| Immigrants | Western Asia | 20.7 /100 | #203 | Fair 13.9% |
| Spaniards | 18.9 /100 | #204 | Poor 13.9% |
| Ugandans | 15.4 /100 | #205 | Poor 14.0% |
| Immigrants | Uruguay | 14.0 /100 | #206 | Poor 14.0% |
| Immigrants | Eastern Africa | 9.0 /100 | #207 | Tragic 14.2% |
| Immigrants | Azores | 7.9 /100 | #208 | Tragic 14.2% |
| Panamanians | 7.7 /100 | #209 | Tragic 14.2% |
Demographics Similar to Samoans by Female Poverty
In terms of female poverty, the demographic groups most similar to Samoans are Immigrants from Germany (13.1%, a difference of 0.17%), Tsimshian (13.1%, a difference of 0.24%), Taiwanese (13.1%, a difference of 0.27%), Immigrants from Fiji (13.2%, a difference of 0.32%), and Armenian (13.2%, a difference of 0.39%).
| Demographics | Rating | Rank | Female Poverty |
| Syrians | 79.6 /100 | #145 | Good 13.0% |
| Immigrants | Peru | 79.1 /100 | #146 | Good 13.0% |
| Immigrants | Kazakhstan | 78.6 /100 | #147 | Good 13.0% |
| Yugoslavians | 76.9 /100 | #148 | Good 13.1% |
| Taiwanese | 75.7 /100 | #149 | Good 13.1% |
| Tsimshian | 75.5 /100 | #150 | Good 13.1% |
| Immigrants | Germany | 74.9 /100 | #151 | Good 13.1% |
| Samoans | 73.6 /100 | #152 | Good 13.1% |
| Immigrants | Fiji | 71.0 /100 | #153 | Good 13.2% |
| Armenians | 70.4 /100 | #154 | Good 13.2% |
| Hungarians | 70.1 /100 | #155 | Good 13.2% |
| Immigrants | Bosnia and Herzegovina | 69.7 /100 | #156 | Good 13.2% |
| Immigrants | Northern Africa | 68.8 /100 | #157 | Good 13.2% |
| Pennsylvania Germans | 67.3 /100 | #158 | Good 13.2% |
| Costa Ricans | 63.6 /100 | #159 | Good 13.3% |