Hmong vs Choctaw Female Poverty
COMPARE
Hmong
Choctaw
Female Poverty
Female Poverty Comparison
Hmong
Choctaw
13.9%
FEMALE POVERTY
21.1/ 100
METRIC RATING
202nd/ 347
METRIC RANK
16.8%
FEMALE POVERTY
0.0/ 100
METRIC RATING
303rd/ 347
METRIC RANK
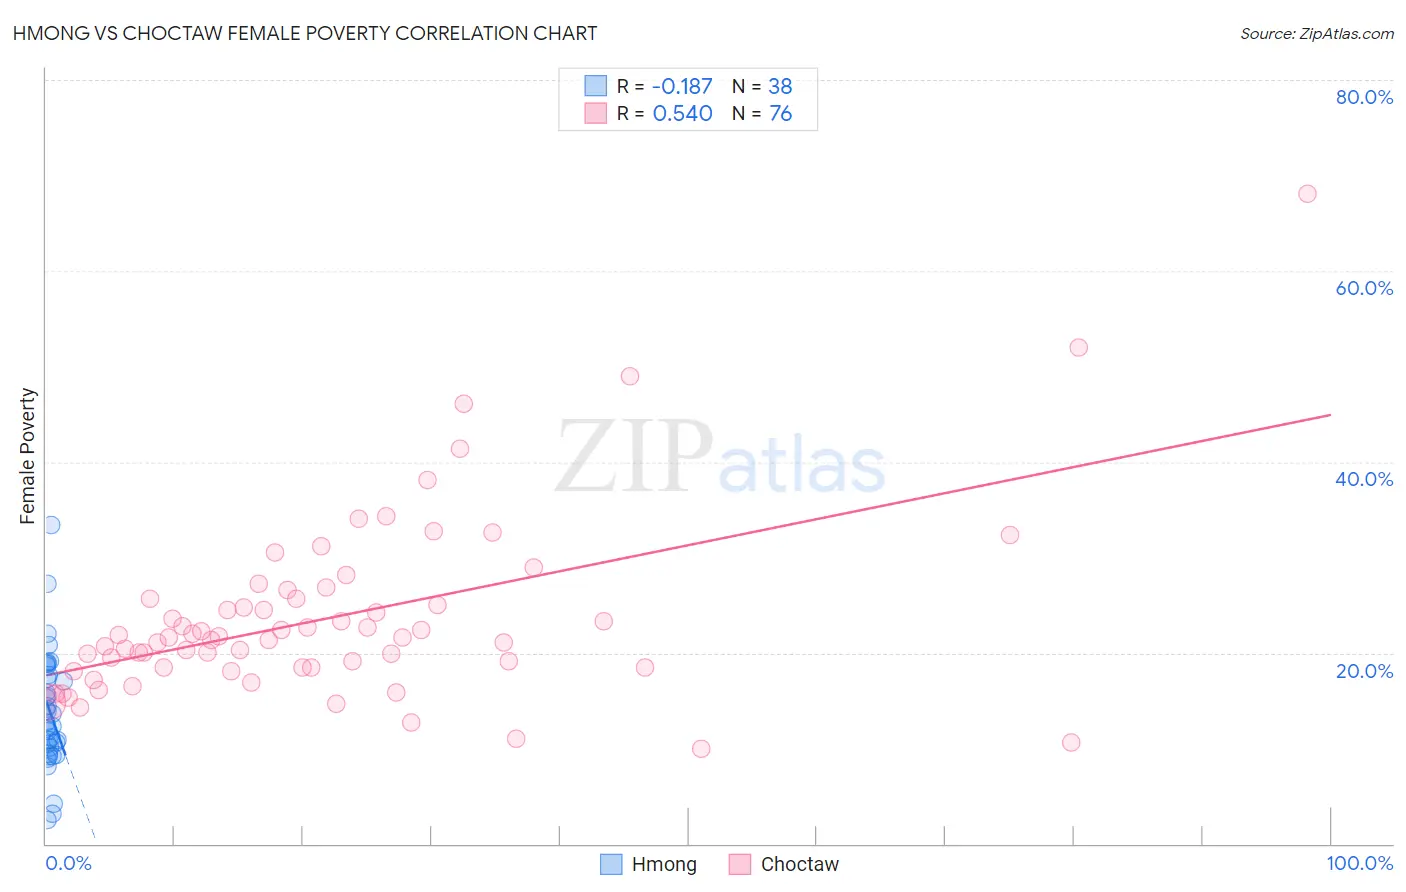
Hmong vs Choctaw Female Poverty Correlation Chart
The statistical analysis conducted on geographies consisting of 24,669,739 people shows a poor negative correlation between the proportion of Hmong and poverty level among females in the United States with a correlation coefficient (R) of -0.187 and weighted average of 13.9%. Similarly, the statistical analysis conducted on geographies consisting of 269,592,766 people shows a substantial positive correlation between the proportion of Choctaw and poverty level among females in the United States with a correlation coefficient (R) of 0.540 and weighted average of 16.8%, a difference of 21.2%.
Female Poverty Correlation Summary
| Measurement | Hmong | Choctaw |
| Minimum | 2.5% | 10.0% |
| Maximum | 33.3% | 68.1% |
| Range | 30.8% | 58.1% |
| Mean | 13.9% | 23.7% |
| Median | 13.2% | 21.6% |
| Interquartile 25% (IQ1) | 10.1% | 18.4% |
| Interquartile 75% (IQ3) | 17.7% | 25.6% |
| Interquartile Range (IQR) | 7.6% | 7.2% |
| Standard Deviation (Sample) | 6.1% | 9.5% |
| Standard Deviation (Population) | 6.1% | 9.5% |
Similar Demographics by Female Poverty
Demographics Similar to Hmong by Female Poverty
In terms of female poverty, the demographic groups most similar to Hmong are Immigrants from Kenya (13.9%, a difference of 0.010%), Spanish (13.9%, a difference of 0.050%), Immigrants from Western Asia (13.9%, a difference of 0.050%), Spaniard (13.9%, a difference of 0.32%), and Immigrants from Lebanon (13.8%, a difference of 0.60%).
| Demographics | Rating | Rank | Female Poverty |
| Immigrants | South America | 30.6 /100 | #195 | Fair 13.7% |
| South American Indians | 28.9 /100 | #196 | Fair 13.7% |
| Arabs | 28.6 /100 | #197 | Fair 13.7% |
| Immigrants | Uganda | 28.5 /100 | #198 | Fair 13.7% |
| Immigrants | Lebanon | 25.6 /100 | #199 | Fair 13.8% |
| Spanish | 21.4 /100 | #200 | Fair 13.9% |
| Immigrants | Kenya | 21.1 /100 | #201 | Fair 13.9% |
| Hmong | 21.1 /100 | #202 | Fair 13.9% |
| Immigrants | Western Asia | 20.7 /100 | #203 | Fair 13.9% |
| Spaniards | 18.9 /100 | #204 | Poor 13.9% |
| Ugandans | 15.4 /100 | #205 | Poor 14.0% |
| Immigrants | Uruguay | 14.0 /100 | #206 | Poor 14.0% |
| Immigrants | Eastern Africa | 9.0 /100 | #207 | Tragic 14.2% |
| Immigrants | Azores | 7.9 /100 | #208 | Tragic 14.2% |
| Panamanians | 7.7 /100 | #209 | Tragic 14.2% |
Demographics Similar to Choctaw by Female Poverty
In terms of female poverty, the demographic groups most similar to Choctaw are Immigrants from Central America (16.8%, a difference of 0.060%), Immigrants from Grenada (16.8%, a difference of 0.070%), Immigrants from Caribbean (16.9%, a difference of 0.33%), Seminole (16.9%, a difference of 0.46%), and African (16.9%, a difference of 0.52%).
| Demographics | Rating | Rank | Female Poverty |
| Immigrants | Senegal | 0.0 /100 | #296 | Tragic 16.5% |
| Mexicans | 0.0 /100 | #297 | Tragic 16.5% |
| Somalis | 0.0 /100 | #298 | Tragic 16.6% |
| Hispanics or Latinos | 0.0 /100 | #299 | Tragic 16.6% |
| Bahamians | 0.0 /100 | #300 | Tragic 16.6% |
| Guatemalans | 0.0 /100 | #301 | Tragic 16.7% |
| Chippewa | 0.0 /100 | #302 | Tragic 16.7% |
| Choctaw | 0.0 /100 | #303 | Tragic 16.8% |
| Immigrants | Central America | 0.0 /100 | #304 | Tragic 16.8% |
| Immigrants | Grenada | 0.0 /100 | #305 | Tragic 16.8% |
| Immigrants | Caribbean | 0.0 /100 | #306 | Tragic 16.9% |
| Seminole | 0.0 /100 | #307 | Tragic 16.9% |
| Africans | 0.0 /100 | #308 | Tragic 16.9% |
| Immigrants | Mexico | 0.0 /100 | #309 | Tragic 17.0% |
| Creek | 0.0 /100 | #310 | Tragic 17.0% |