Hmong vs Assyrian/Chaldean/Syriac Female Poverty
COMPARE
Hmong
Assyrian/Chaldean/Syriac
Female Poverty
Female Poverty Comparison
Hmong
Assyrians/Chaldeans/Syriacs
13.9%
FEMALE POVERTY
21.1/ 100
METRIC RATING
202nd/ 347
METRIC RANK
11.0%
FEMALE POVERTY
99.9/ 100
METRIC RATING
7th/ 347
METRIC RANK
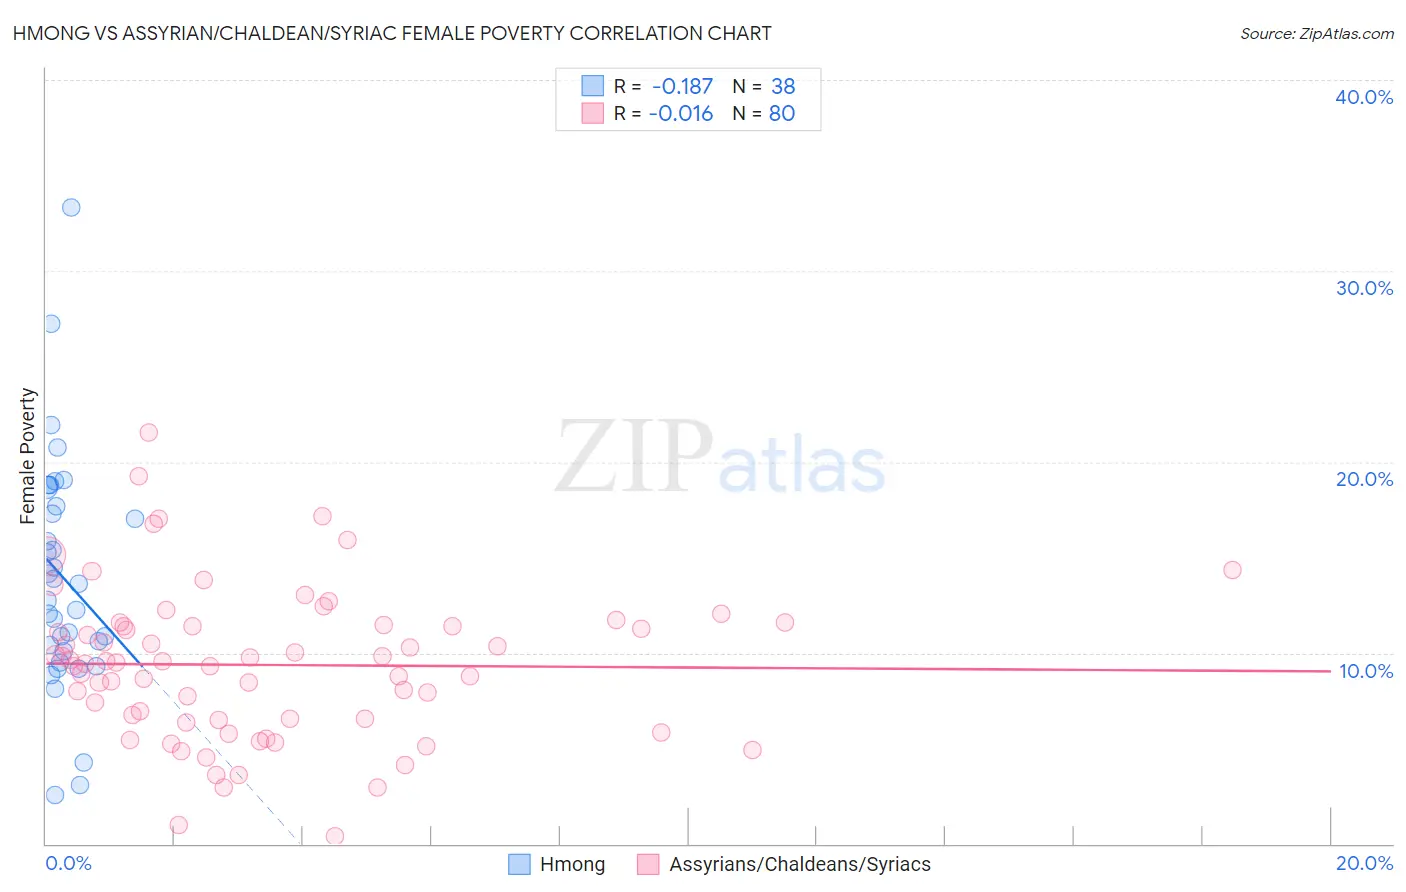
Hmong vs Assyrian/Chaldean/Syriac Female Poverty Correlation Chart
The statistical analysis conducted on geographies consisting of 24,669,739 people shows a poor negative correlation between the proportion of Hmong and poverty level among females in the United States with a correlation coefficient (R) of -0.187 and weighted average of 13.9%. Similarly, the statistical analysis conducted on geographies consisting of 110,294,080 people shows no correlation between the proportion of Assyrians/Chaldeans/Syriacs and poverty level among females in the United States with a correlation coefficient (R) of -0.016 and weighted average of 11.0%, a difference of 25.7%.
Female Poverty Correlation Summary
| Measurement | Hmong | Assyrian/Chaldean/Syriac |
| Minimum | 2.5% | 0.39% |
| Maximum | 33.3% | 21.5% |
| Range | 30.8% | 21.1% |
| Mean | 13.9% | 9.4% |
| Median | 13.2% | 9.5% |
| Interquartile 25% (IQ1) | 10.1% | 6.5% |
| Interquartile 75% (IQ3) | 17.7% | 11.4% |
| Interquartile Range (IQR) | 7.6% | 4.9% |
| Standard Deviation (Sample) | 6.1% | 4.0% |
| Standard Deviation (Population) | 6.1% | 4.0% |
Similar Demographics by Female Poverty
Demographics Similar to Hmong by Female Poverty
In terms of female poverty, the demographic groups most similar to Hmong are Immigrants from Kenya (13.9%, a difference of 0.010%), Spanish (13.9%, a difference of 0.050%), Immigrants from Western Asia (13.9%, a difference of 0.050%), Spaniard (13.9%, a difference of 0.32%), and Immigrants from Lebanon (13.8%, a difference of 0.60%).
| Demographics | Rating | Rank | Female Poverty |
| Immigrants | South America | 30.6 /100 | #195 | Fair 13.7% |
| South American Indians | 28.9 /100 | #196 | Fair 13.7% |
| Arabs | 28.6 /100 | #197 | Fair 13.7% |
| Immigrants | Uganda | 28.5 /100 | #198 | Fair 13.7% |
| Immigrants | Lebanon | 25.6 /100 | #199 | Fair 13.8% |
| Spanish | 21.4 /100 | #200 | Fair 13.9% |
| Immigrants | Kenya | 21.1 /100 | #201 | Fair 13.9% |
| Hmong | 21.1 /100 | #202 | Fair 13.9% |
| Immigrants | Western Asia | 20.7 /100 | #203 | Fair 13.9% |
| Spaniards | 18.9 /100 | #204 | Poor 13.9% |
| Ugandans | 15.4 /100 | #205 | Poor 14.0% |
| Immigrants | Uruguay | 14.0 /100 | #206 | Poor 14.0% |
| Immigrants | Eastern Africa | 9.0 /100 | #207 | Tragic 14.2% |
| Immigrants | Azores | 7.9 /100 | #208 | Tragic 14.2% |
| Panamanians | 7.7 /100 | #209 | Tragic 14.2% |
Demographics Similar to Assyrians/Chaldeans/Syriacs by Female Poverty
In terms of female poverty, the demographic groups most similar to Assyrians/Chaldeans/Syriacs are Immigrants from Ireland (11.0%, a difference of 0.37%), Immigrants from South Central Asia (11.1%, a difference of 0.70%), Filipino (10.9%, a difference of 0.75%), Bulgarian (11.1%, a difference of 0.89%), and Immigrants from Hong Kong (11.2%, a difference of 1.7%).
| Demographics | Rating | Rank | Female Poverty |
| Immigrants | India | 100.0 /100 | #1 | Exceptional 9.9% |
| Chinese | 100.0 /100 | #2 | Exceptional 10.4% |
| Thais | 100.0 /100 | #3 | Exceptional 10.5% |
| Immigrants | Taiwan | 100.0 /100 | #4 | Exceptional 10.5% |
| Filipinos | 100.0 /100 | #5 | Exceptional 10.9% |
| Immigrants | Ireland | 99.9 /100 | #6 | Exceptional 11.0% |
| Assyrians/Chaldeans/Syriacs | 99.9 /100 | #7 | Exceptional 11.0% |
| Immigrants | South Central Asia | 99.9 /100 | #8 | Exceptional 11.1% |
| Bulgarians | 99.9 /100 | #9 | Exceptional 11.1% |
| Immigrants | Hong Kong | 99.9 /100 | #10 | Exceptional 11.2% |
| Maltese | 99.9 /100 | #11 | Exceptional 11.2% |
| Bhutanese | 99.9 /100 | #12 | Exceptional 11.3% |
| Immigrants | Lithuania | 99.9 /100 | #13 | Exceptional 11.3% |
| Lithuanians | 99.8 /100 | #14 | Exceptional 11.4% |
| Latvians | 99.8 /100 | #15 | Exceptional 11.4% |