Immigrants from Mexico vs Samoan Female Poverty
COMPARE
Immigrants from Mexico
Samoan
Female Poverty
Female Poverty Comparison
Immigrants from Mexico
Samoans
17.0%
FEMALE POVERTY
0.0/ 100
METRIC RATING
309th/ 347
METRIC RANK
13.1%
FEMALE POVERTY
73.6/ 100
METRIC RATING
152nd/ 347
METRIC RANK
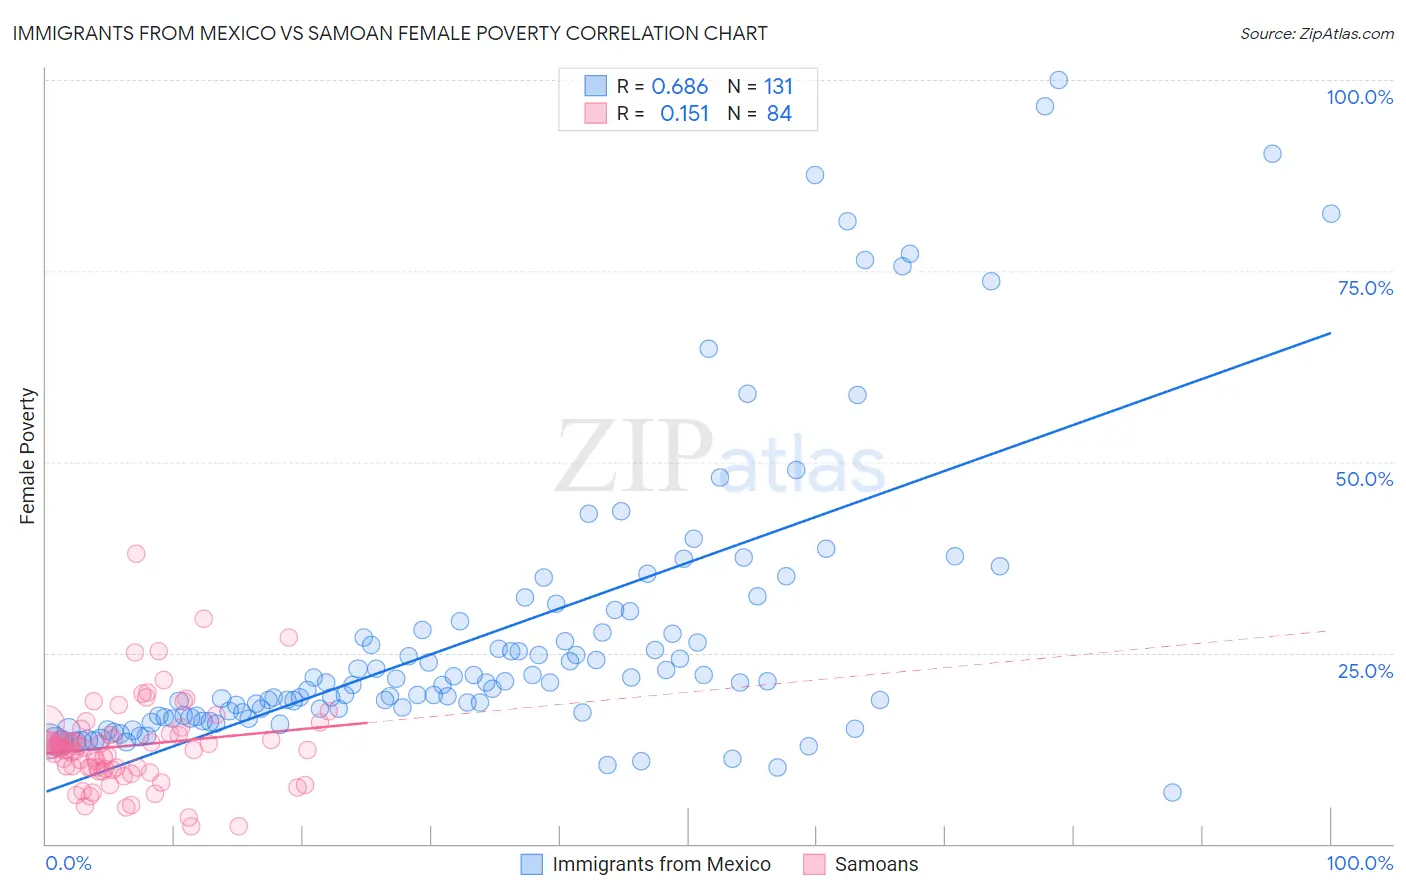
Immigrants from Mexico vs Samoan Female Poverty Correlation Chart
The statistical analysis conducted on geographies consisting of 513,228,632 people shows a significant positive correlation between the proportion of Immigrants from Mexico and poverty level among females in the United States with a correlation coefficient (R) of 0.686 and weighted average of 17.0%. Similarly, the statistical analysis conducted on geographies consisting of 225,052,897 people shows a poor positive correlation between the proportion of Samoans and poverty level among females in the United States with a correlation coefficient (R) of 0.151 and weighted average of 13.1%, a difference of 29.4%.
Female Poverty Correlation Summary
| Measurement | Immigrants from Mexico | Samoan |
| Minimum | 6.7% | 2.3% |
| Maximum | 100.0% | 38.0% |
| Range | 93.3% | 35.7% |
| Mean | 27.4% | 12.8% |
| Median | 21.1% | 12.5% |
| Interquartile 25% (IQ1) | 16.7% | 9.7% |
| Interquartile 75% (IQ3) | 28.0% | 14.4% |
| Interquartile Range (IQR) | 11.3% | 4.7% |
| Standard Deviation (Sample) | 19.2% | 5.8% |
| Standard Deviation (Population) | 19.1% | 5.8% |
Similar Demographics by Female Poverty
Demographics Similar to Immigrants from Mexico by Female Poverty
In terms of female poverty, the demographic groups most similar to Immigrants from Mexico are Creek (17.0%, a difference of 0.24%), Immigrants from Guatemala (17.0%, a difference of 0.24%), Immigrants from Somalia (17.0%, a difference of 0.34%), African (16.9%, a difference of 0.39%), and British West Indian (17.0%, a difference of 0.41%).
| Demographics | Rating | Rank | Female Poverty |
| Chippewa | 0.0 /100 | #302 | Tragic 16.7% |
| Choctaw | 0.0 /100 | #303 | Tragic 16.8% |
| Immigrants | Central America | 0.0 /100 | #304 | Tragic 16.8% |
| Immigrants | Grenada | 0.0 /100 | #305 | Tragic 16.8% |
| Immigrants | Caribbean | 0.0 /100 | #306 | Tragic 16.9% |
| Seminole | 0.0 /100 | #307 | Tragic 16.9% |
| Africans | 0.0 /100 | #308 | Tragic 16.9% |
| Immigrants | Mexico | 0.0 /100 | #309 | Tragic 17.0% |
| Creek | 0.0 /100 | #310 | Tragic 17.0% |
| Immigrants | Guatemala | 0.0 /100 | #311 | Tragic 17.0% |
| Immigrants | Somalia | 0.0 /100 | #312 | Tragic 17.0% |
| British West Indians | 0.0 /100 | #313 | Tragic 17.0% |
| Dutch West Indians | 0.0 /100 | #314 | Tragic 17.1% |
| U.S. Virgin Islanders | 0.0 /100 | #315 | Tragic 17.3% |
| Hondurans | 0.0 /100 | #316 | Tragic 17.4% |
Demographics Similar to Samoans by Female Poverty
In terms of female poverty, the demographic groups most similar to Samoans are Immigrants from Germany (13.1%, a difference of 0.17%), Tsimshian (13.1%, a difference of 0.24%), Taiwanese (13.1%, a difference of 0.27%), Immigrants from Fiji (13.2%, a difference of 0.32%), and Armenian (13.2%, a difference of 0.39%).
| Demographics | Rating | Rank | Female Poverty |
| Syrians | 79.6 /100 | #145 | Good 13.0% |
| Immigrants | Peru | 79.1 /100 | #146 | Good 13.0% |
| Immigrants | Kazakhstan | 78.6 /100 | #147 | Good 13.0% |
| Yugoslavians | 76.9 /100 | #148 | Good 13.1% |
| Taiwanese | 75.7 /100 | #149 | Good 13.1% |
| Tsimshian | 75.5 /100 | #150 | Good 13.1% |
| Immigrants | Germany | 74.9 /100 | #151 | Good 13.1% |
| Samoans | 73.6 /100 | #152 | Good 13.1% |
| Immigrants | Fiji | 71.0 /100 | #153 | Good 13.2% |
| Armenians | 70.4 /100 | #154 | Good 13.2% |
| Hungarians | 70.1 /100 | #155 | Good 13.2% |
| Immigrants | Bosnia and Herzegovina | 69.7 /100 | #156 | Good 13.2% |
| Immigrants | Northern Africa | 68.8 /100 | #157 | Good 13.2% |
| Pennsylvania Germans | 67.3 /100 | #158 | Good 13.2% |
| Costa Ricans | 63.6 /100 | #159 | Good 13.3% |