Immigrants from Western Europe vs Samoan Female Poverty
COMPARE
Immigrants from Western Europe
Samoan
Female Poverty
Female Poverty Comparison
Immigrants from Western Europe
Samoans
12.8%
FEMALE POVERTY
86.6/ 100
METRIC RATING
133rd/ 347
METRIC RANK
13.1%
FEMALE POVERTY
73.6/ 100
METRIC RATING
152nd/ 347
METRIC RANK
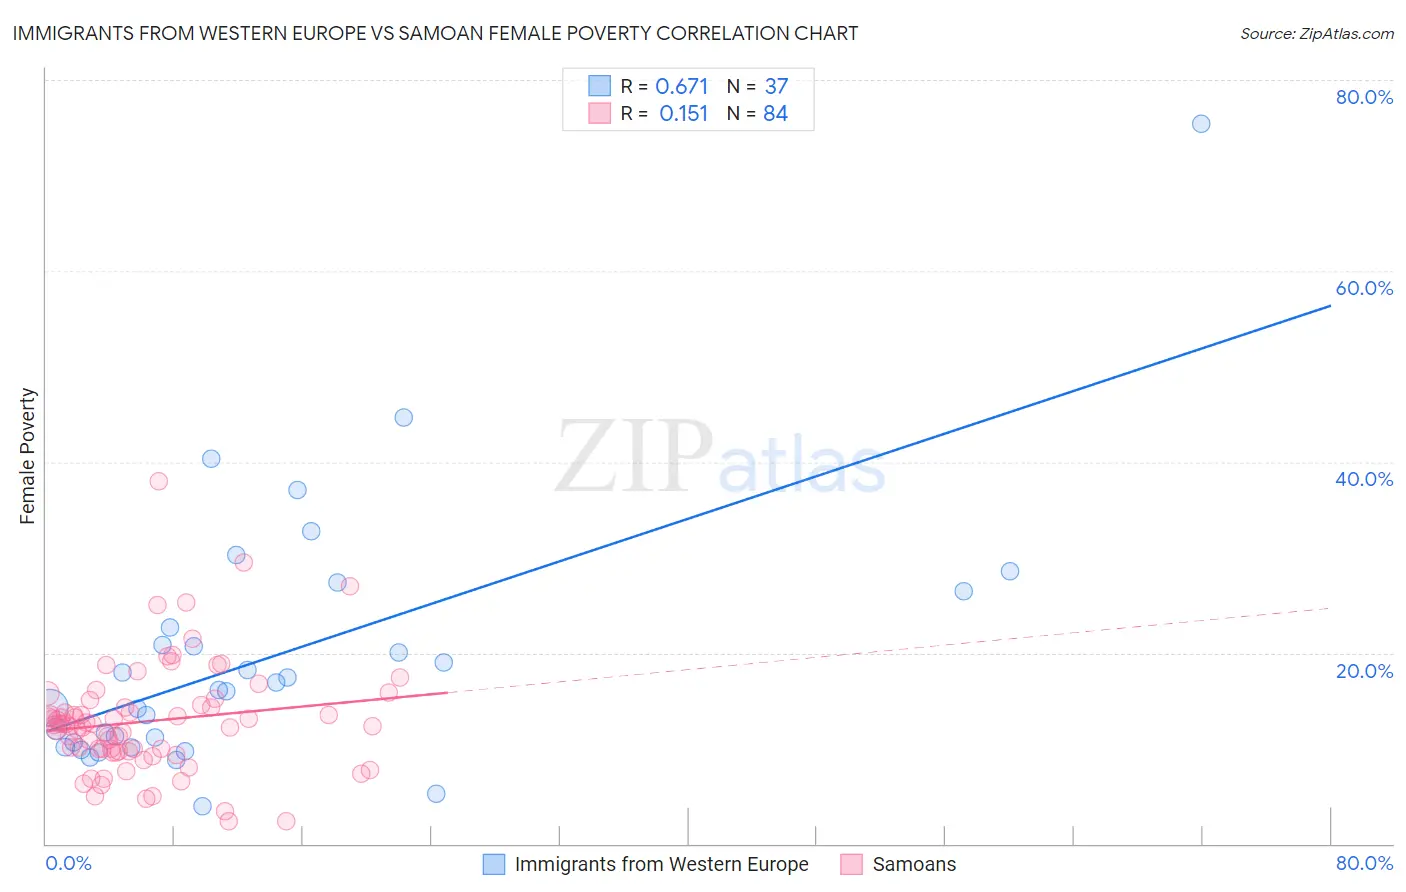
Immigrants from Western Europe vs Samoan Female Poverty Correlation Chart
The statistical analysis conducted on geographies consisting of 493,604,679 people shows a significant positive correlation between the proportion of Immigrants from Western Europe and poverty level among females in the United States with a correlation coefficient (R) of 0.671 and weighted average of 12.8%. Similarly, the statistical analysis conducted on geographies consisting of 225,052,897 people shows a poor positive correlation between the proportion of Samoans and poverty level among females in the United States with a correlation coefficient (R) of 0.151 and weighted average of 13.1%, a difference of 2.1%.
Female Poverty Correlation Summary
| Measurement | Immigrants from Western Europe | Samoan |
| Minimum | 4.0% | 2.3% |
| Maximum | 75.4% | 38.0% |
| Range | 71.4% | 35.7% |
| Mean | 19.6% | 12.8% |
| Median | 16.1% | 12.5% |
| Interquartile 25% (IQ1) | 10.4% | 9.7% |
| Interquartile 75% (IQ3) | 24.5% | 14.4% |
| Interquartile Range (IQR) | 14.2% | 4.7% |
| Standard Deviation (Sample) | 13.5% | 5.8% |
| Standard Deviation (Population) | 13.4% | 5.8% |
Demographics Similar to Immigrants from Western Europe and Samoans by Female Poverty
In terms of female poverty, the demographic groups most similar to Immigrants from Western Europe are Immigrants from Jordan (12.8%, a difference of 0.060%), Immigrants from Switzerland (12.9%, a difference of 0.16%), French (12.9%, a difference of 0.22%), Peruvian (12.9%, a difference of 0.30%), and Chilean (12.9%, a difference of 0.38%). Similarly, the demographic groups most similar to Samoans are Immigrants from Germany (13.1%, a difference of 0.17%), Tsimshian (13.1%, a difference of 0.24%), Taiwanese (13.1%, a difference of 0.27%), Yugoslavian (13.1%, a difference of 0.43%), and Immigrants from Kazakhstan (13.0%, a difference of 0.68%).
| Demographics | Rating | Rank | Female Poverty |
| Immigrants | Jordan | 86.9 /100 | #132 | Excellent 12.8% |
| Immigrants | Western Europe | 86.6 /100 | #133 | Excellent 12.8% |
| Immigrants | Switzerland | 85.8 /100 | #134 | Excellent 12.9% |
| French | 85.6 /100 | #135 | Excellent 12.9% |
| Peruvians | 85.2 /100 | #136 | Excellent 12.9% |
| Chileans | 84.7 /100 | #137 | Excellent 12.9% |
| Immigrants | France | 83.6 /100 | #138 | Excellent 12.9% |
| Basques | 83.1 /100 | #139 | Excellent 12.9% |
| Pakistanis | 83.0 /100 | #140 | Excellent 12.9% |
| Icelanders | 81.1 /100 | #141 | Excellent 13.0% |
| Brazilians | 80.5 /100 | #142 | Excellent 13.0% |
| Immigrants | Malaysia | 80.4 /100 | #143 | Excellent 13.0% |
| Afghans | 79.8 /100 | #144 | Good 13.0% |
| Syrians | 79.6 /100 | #145 | Good 13.0% |
| Immigrants | Peru | 79.1 /100 | #146 | Good 13.0% |
| Immigrants | Kazakhstan | 78.6 /100 | #147 | Good 13.0% |
| Yugoslavians | 76.9 /100 | #148 | Good 13.1% |
| Taiwanese | 75.7 /100 | #149 | Good 13.1% |
| Tsimshian | 75.5 /100 | #150 | Good 13.1% |
| Immigrants | Germany | 74.9 /100 | #151 | Good 13.1% |
| Samoans | 73.6 /100 | #152 | Good 13.1% |