Hmong vs Central American Indian Female Poverty
COMPARE
Hmong
Central American Indian
Female Poverty
Female Poverty Comparison
Hmong
Central American Indians
13.9%
FEMALE POVERTY
21.1/ 100
METRIC RATING
202nd/ 347
METRIC RANK
18.0%
FEMALE POVERTY
0.0/ 100
METRIC RATING
326th/ 347
METRIC RANK
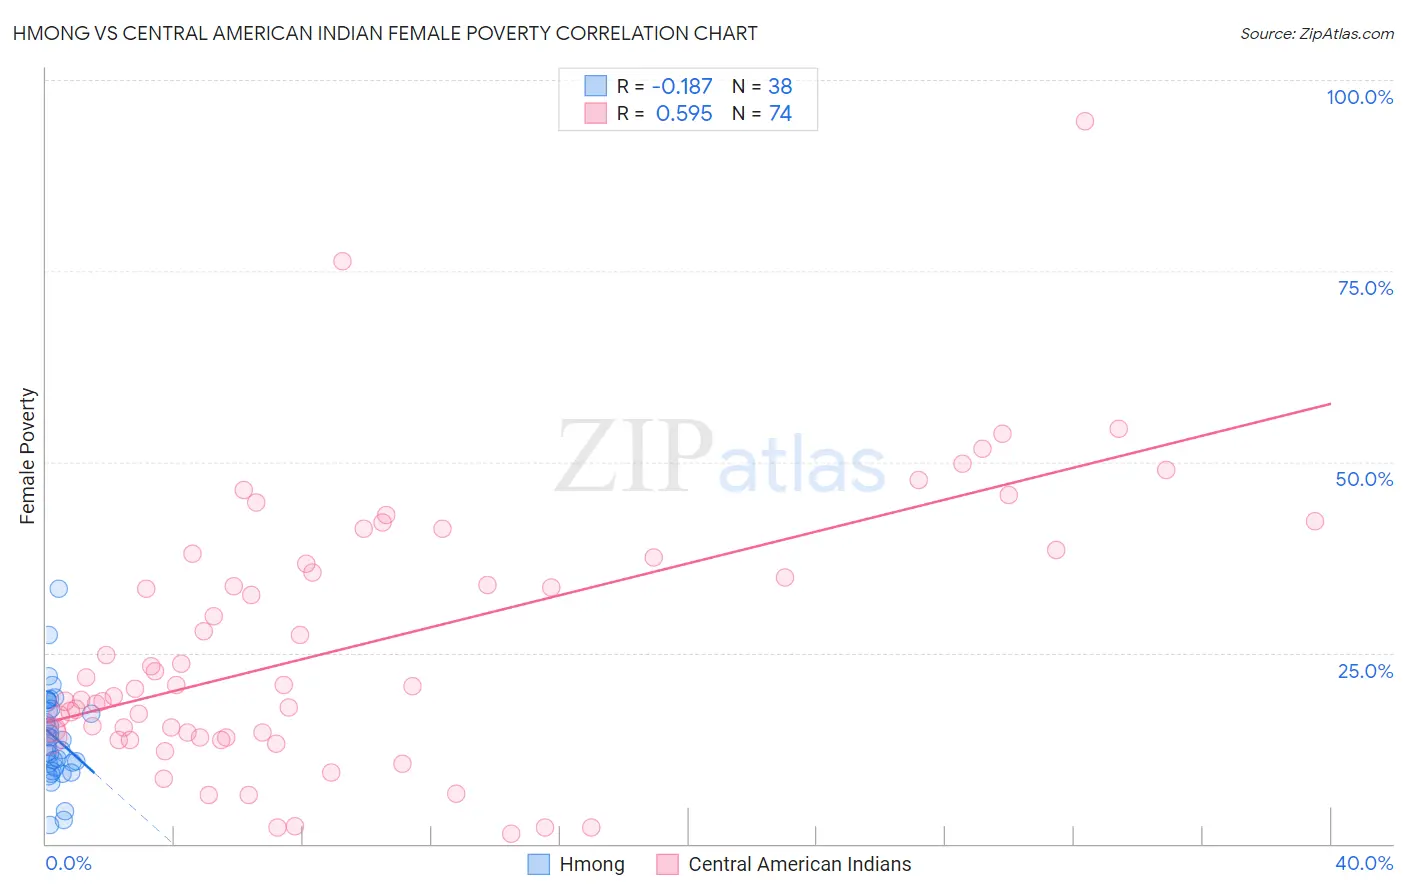
Hmong vs Central American Indian Female Poverty Correlation Chart
The statistical analysis conducted on geographies consisting of 24,669,739 people shows a poor negative correlation between the proportion of Hmong and poverty level among females in the United States with a correlation coefficient (R) of -0.187 and weighted average of 13.9%. Similarly, the statistical analysis conducted on geographies consisting of 326,040,737 people shows a substantial positive correlation between the proportion of Central American Indians and poverty level among females in the United States with a correlation coefficient (R) of 0.595 and weighted average of 18.0%, a difference of 30.0%.
Female Poverty Correlation Summary
| Measurement | Hmong | Central American Indian |
| Minimum | 2.5% | 1.4% |
| Maximum | 33.3% | 94.5% |
| Range | 30.8% | 93.2% |
| Mean | 13.9% | 26.1% |
| Median | 13.2% | 20.8% |
| Interquartile 25% (IQ1) | 10.1% | 14.1% |
| Interquartile 75% (IQ3) | 17.7% | 37.5% |
| Interquartile Range (IQR) | 7.6% | 23.4% |
| Standard Deviation (Sample) | 6.1% | 17.4% |
| Standard Deviation (Population) | 6.1% | 17.3% |
Similar Demographics by Female Poverty
Demographics Similar to Hmong by Female Poverty
In terms of female poverty, the demographic groups most similar to Hmong are Immigrants from Kenya (13.9%, a difference of 0.010%), Spanish (13.9%, a difference of 0.050%), Immigrants from Western Asia (13.9%, a difference of 0.050%), Spaniard (13.9%, a difference of 0.32%), and Immigrants from Lebanon (13.8%, a difference of 0.60%).
| Demographics | Rating | Rank | Female Poverty |
| Immigrants | South America | 30.6 /100 | #195 | Fair 13.7% |
| South American Indians | 28.9 /100 | #196 | Fair 13.7% |
| Arabs | 28.6 /100 | #197 | Fair 13.7% |
| Immigrants | Uganda | 28.5 /100 | #198 | Fair 13.7% |
| Immigrants | Lebanon | 25.6 /100 | #199 | Fair 13.8% |
| Spanish | 21.4 /100 | #200 | Fair 13.9% |
| Immigrants | Kenya | 21.1 /100 | #201 | Fair 13.9% |
| Hmong | 21.1 /100 | #202 | Fair 13.9% |
| Immigrants | Western Asia | 20.7 /100 | #203 | Fair 13.9% |
| Spaniards | 18.9 /100 | #204 | Poor 13.9% |
| Ugandans | 15.4 /100 | #205 | Poor 14.0% |
| Immigrants | Uruguay | 14.0 /100 | #206 | Poor 14.0% |
| Immigrants | Eastern Africa | 9.0 /100 | #207 | Tragic 14.2% |
| Immigrants | Azores | 7.9 /100 | #208 | Tragic 14.2% |
| Panamanians | 7.7 /100 | #209 | Tragic 14.2% |
Demographics Similar to Central American Indians by Female Poverty
In terms of female poverty, the demographic groups most similar to Central American Indians are Yakama (18.0%, a difference of 0.10%), Colville (17.8%, a difference of 1.5%), Immigrants from Honduras (17.7%, a difference of 1.7%), Paiute (17.7%, a difference of 1.9%), and Menominee (17.6%, a difference of 2.5%).
| Demographics | Rating | Rank | Female Poverty |
| Cajuns | 0.0 /100 | #319 | Tragic 17.5% |
| Immigrants | Dominica | 0.0 /100 | #320 | Tragic 17.5% |
| Arapaho | 0.0 /100 | #321 | Tragic 17.5% |
| Menominee | 0.0 /100 | #322 | Tragic 17.6% |
| Paiute | 0.0 /100 | #323 | Tragic 17.7% |
| Immigrants | Honduras | 0.0 /100 | #324 | Tragic 17.7% |
| Colville | 0.0 /100 | #325 | Tragic 17.8% |
| Central American Indians | 0.0 /100 | #326 | Tragic 18.0% |
| Yakama | 0.0 /100 | #327 | Tragic 18.0% |
| Blacks/African Americans | 0.0 /100 | #328 | Tragic 18.6% |
| Kiowa | 0.0 /100 | #329 | Tragic 18.6% |
| Dominicans | 0.0 /100 | #330 | Tragic 19.1% |
| Natives/Alaskans | 0.0 /100 | #331 | Tragic 19.2% |
| Apache | 0.0 /100 | #332 | Tragic 19.2% |
| Immigrants | Dominican Republic | 0.0 /100 | #333 | Tragic 19.3% |