Hmong vs Immigrants from Belarus Female Poverty
COMPARE
Hmong
Immigrants from Belarus
Female Poverty
Female Poverty Comparison
Hmong
Immigrants from Belarus
13.9%
FEMALE POVERTY
21.1/ 100
METRIC RATING
202nd/ 347
METRIC RANK
12.8%
FEMALE POVERTY
88.2/ 100
METRIC RATING
128th/ 347
METRIC RANK
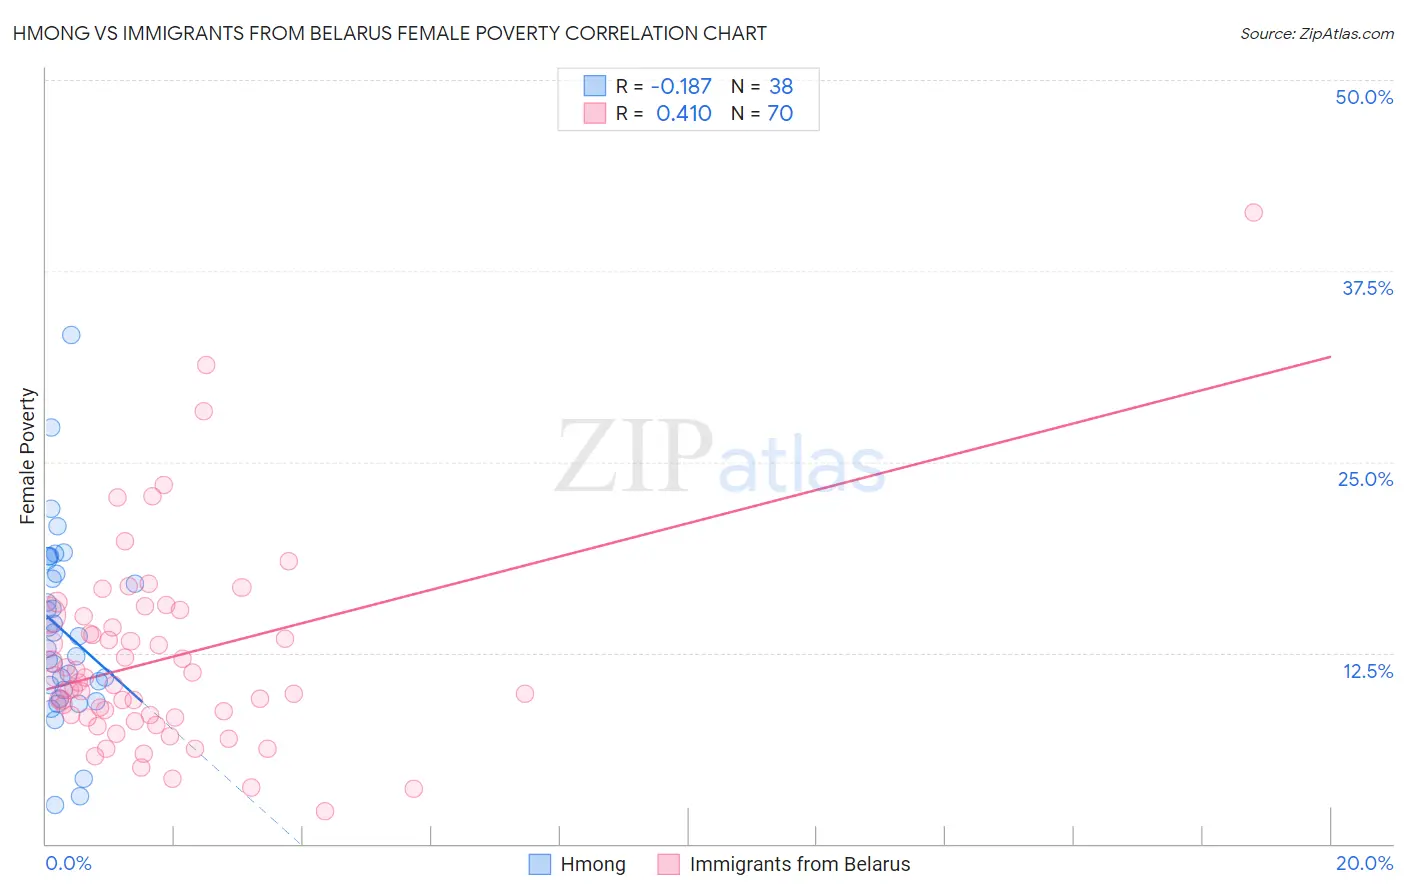
Hmong vs Immigrants from Belarus Female Poverty Correlation Chart
The statistical analysis conducted on geographies consisting of 24,669,739 people shows a poor negative correlation between the proportion of Hmong and poverty level among females in the United States with a correlation coefficient (R) of -0.187 and weighted average of 13.9%. Similarly, the statistical analysis conducted on geographies consisting of 150,175,369 people shows a moderate positive correlation between the proportion of Immigrants from Belarus and poverty level among females in the United States with a correlation coefficient (R) of 0.410 and weighted average of 12.8%, a difference of 8.4%.
Female Poverty Correlation Summary
| Measurement | Hmong | Immigrants from Belarus |
| Minimum | 2.5% | 2.1% |
| Maximum | 33.3% | 41.3% |
| Range | 30.8% | 39.2% |
| Mean | 13.9% | 12.1% |
| Median | 13.2% | 10.5% |
| Interquartile 25% (IQ1) | 10.1% | 8.3% |
| Interquartile 75% (IQ3) | 17.7% | 14.9% |
| Interquartile Range (IQR) | 7.6% | 6.6% |
| Standard Deviation (Sample) | 6.1% | 6.5% |
| Standard Deviation (Population) | 6.1% | 6.5% |
Similar Demographics by Female Poverty
Demographics Similar to Hmong by Female Poverty
In terms of female poverty, the demographic groups most similar to Hmong are Immigrants from Kenya (13.9%, a difference of 0.010%), Spanish (13.9%, a difference of 0.050%), Immigrants from Western Asia (13.9%, a difference of 0.050%), Spaniard (13.9%, a difference of 0.32%), and Immigrants from Lebanon (13.8%, a difference of 0.60%).
| Demographics | Rating | Rank | Female Poverty |
| Immigrants | South America | 30.6 /100 | #195 | Fair 13.7% |
| South American Indians | 28.9 /100 | #196 | Fair 13.7% |
| Arabs | 28.6 /100 | #197 | Fair 13.7% |
| Immigrants | Uganda | 28.5 /100 | #198 | Fair 13.7% |
| Immigrants | Lebanon | 25.6 /100 | #199 | Fair 13.8% |
| Spanish | 21.4 /100 | #200 | Fair 13.9% |
| Immigrants | Kenya | 21.1 /100 | #201 | Fair 13.9% |
| Hmong | 21.1 /100 | #202 | Fair 13.9% |
| Immigrants | Western Asia | 20.7 /100 | #203 | Fair 13.9% |
| Spaniards | 18.9 /100 | #204 | Poor 13.9% |
| Ugandans | 15.4 /100 | #205 | Poor 14.0% |
| Immigrants | Uruguay | 14.0 /100 | #206 | Poor 14.0% |
| Immigrants | Eastern Africa | 9.0 /100 | #207 | Tragic 14.2% |
| Immigrants | Azores | 7.9 /100 | #208 | Tragic 14.2% |
| Panamanians | 7.7 /100 | #209 | Tragic 14.2% |
Demographics Similar to Immigrants from Belarus by Female Poverty
In terms of female poverty, the demographic groups most similar to Immigrants from Belarus are South African (12.8%, a difference of 0.040%), Immigrants from Brazil (12.8%, a difference of 0.070%), Immigrants from Ukraine (12.8%, a difference of 0.14%), Argentinean (12.8%, a difference of 0.22%), and Immigrants from Norway (12.8%, a difference of 0.27%).
| Demographics | Rating | Rank | Female Poverty |
| Immigrants | Hungary | 90.3 /100 | #121 | Exceptional 12.7% |
| French Canadians | 90.2 /100 | #122 | Exceptional 12.7% |
| Immigrants | South Eastern Asia | 89.9 /100 | #123 | Excellent 12.7% |
| Immigrants | Norway | 89.3 /100 | #124 | Excellent 12.8% |
| Argentineans | 89.1 /100 | #125 | Excellent 12.8% |
| Immigrants | Ukraine | 88.8 /100 | #126 | Excellent 12.8% |
| South Africans | 88.4 /100 | #127 | Excellent 12.8% |
| Immigrants | Belarus | 88.2 /100 | #128 | Excellent 12.8% |
| Immigrants | Brazil | 87.9 /100 | #129 | Excellent 12.8% |
| Immigrants | Vietnam | 87.1 /100 | #130 | Excellent 12.8% |
| Immigrants | Argentina | 87.0 /100 | #131 | Excellent 12.8% |
| Immigrants | Jordan | 86.9 /100 | #132 | Excellent 12.8% |
| Immigrants | Western Europe | 86.6 /100 | #133 | Excellent 12.8% |
| Immigrants | Switzerland | 85.8 /100 | #134 | Excellent 12.9% |
| French | 85.6 /100 | #135 | Excellent 12.9% |