Immigrants from Northern Europe vs Okinawan Married-Couple Family Poverty
COMPARE
Immigrants from Northern Europe
Okinawan
Married-Couple Family Poverty
Married-Couple Family Poverty Comparison
Immigrants from Northern Europe
Okinawans
4.2%
MARRIED-COUPLE FAMILY POVERTY
99.8/ 100
METRIC RATING
39th/ 347
METRIC RANK
4.4%
MARRIED-COUPLE FAMILY POVERTY
99.6/ 100
METRIC RATING
61st/ 347
METRIC RANK
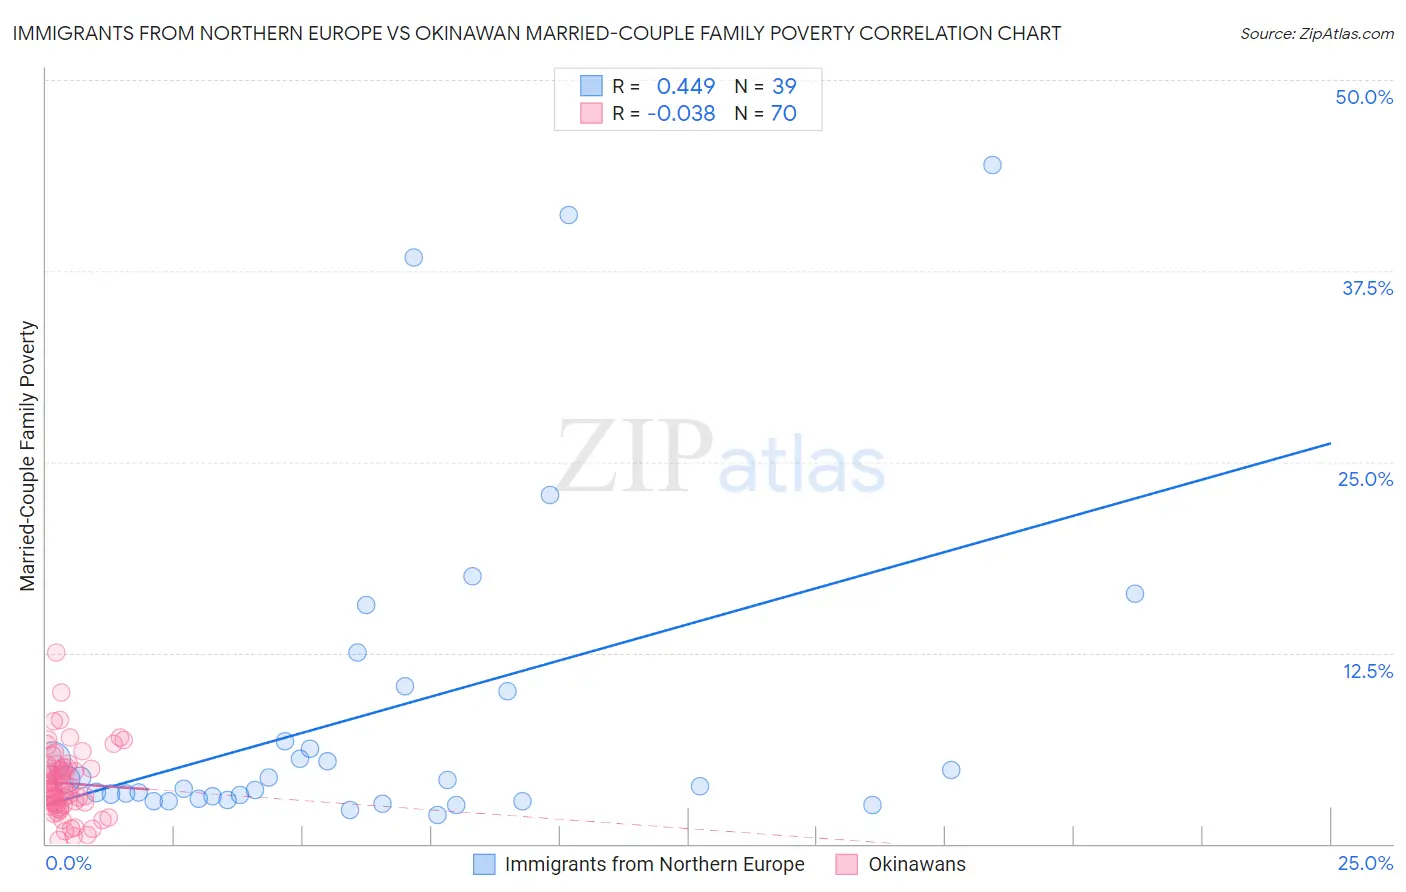
Immigrants from Northern Europe vs Okinawan Married-Couple Family Poverty Correlation Chart
The statistical analysis conducted on geographies consisting of 470,220,521 people shows a moderate positive correlation between the proportion of Immigrants from Northern Europe and poverty level among married-couple families in the United States with a correlation coefficient (R) of 0.449 and weighted average of 4.2%. Similarly, the statistical analysis conducted on geographies consisting of 73,604,889 people shows no correlation between the proportion of Okinawans and poverty level among married-couple families in the United States with a correlation coefficient (R) of -0.038 and weighted average of 4.4%, a difference of 3.4%.
Married-Couple Family Poverty Correlation Summary
| Measurement | Immigrants from Northern Europe | Okinawan |
| Minimum | 1.9% | 0.25% |
| Maximum | 44.4% | 12.5% |
| Range | 42.6% | 12.3% |
| Mean | 8.6% | 4.0% |
| Median | 4.2% | 3.7% |
| Interquartile 25% (IQ1) | 3.0% | 2.5% |
| Interquartile 75% (IQ3) | 10.0% | 5.0% |
| Interquartile Range (IQR) | 7.0% | 2.5% |
| Standard Deviation (Sample) | 10.7% | 2.2% |
| Standard Deviation (Population) | 10.6% | 2.2% |
Similar Demographics by Married-Couple Family Poverty
Demographics Similar to Immigrants from Northern Europe by Married-Couple Family Poverty
In terms of married-couple family poverty, the demographic groups most similar to Immigrants from Northern Europe are Belgian (4.2%, a difference of 0.13%), Iranian (4.2%, a difference of 0.25%), French Canadian (4.2%, a difference of 0.28%), English (4.2%, a difference of 0.32%), and European (4.2%, a difference of 0.35%).
| Demographics | Rating | Rank | Married-Couple Family Poverty |
| Greeks | 99.9 /100 | #32 | Exceptional 4.2% |
| Irish | 99.9 /100 | #33 | Exceptional 4.2% |
| Dutch | 99.9 /100 | #34 | Exceptional 4.2% |
| Europeans | 99.9 /100 | #35 | Exceptional 4.2% |
| English | 99.9 /100 | #36 | Exceptional 4.2% |
| Iranians | 99.9 /100 | #37 | Exceptional 4.2% |
| Belgians | 99.9 /100 | #38 | Exceptional 4.2% |
| Immigrants | Northern Europe | 99.8 /100 | #39 | Exceptional 4.2% |
| French Canadians | 99.8 /100 | #40 | Exceptional 4.2% |
| Northern Europeans | 99.8 /100 | #41 | Exceptional 4.3% |
| Scottish | 99.8 /100 | #42 | Exceptional 4.3% |
| Swiss | 99.8 /100 | #43 | Exceptional 4.3% |
| Immigrants | Japan | 99.8 /100 | #44 | Exceptional 4.3% |
| Serbians | 99.8 /100 | #45 | Exceptional 4.3% |
| British | 99.8 /100 | #46 | Exceptional 4.3% |
Demographics Similar to Okinawans by Married-Couple Family Poverty
In terms of married-couple family poverty, the demographic groups most similar to Okinawans are Immigrants from Australia (4.4%, a difference of 0.010%), Tlingit-Haida (4.4%, a difference of 0.11%), Immigrants from Sweden (4.4%, a difference of 0.18%), Immigrants from Sri Lanka (4.4%, a difference of 0.37%), and Czechoslovakian (4.4%, a difference of 0.73%).
| Demographics | Rating | Rank | Married-Couple Family Poverty |
| Austrians | 99.7 /100 | #54 | Exceptional 4.3% |
| French | 99.7 /100 | #55 | Exceptional 4.3% |
| Immigrants | Zimbabwe | 99.7 /100 | #56 | Exceptional 4.3% |
| Immigrants | Netherlands | 99.7 /100 | #57 | Exceptional 4.3% |
| Czechoslovakians | 99.7 /100 | #58 | Exceptional 4.4% |
| Immigrants | Sweden | 99.6 /100 | #59 | Exceptional 4.4% |
| Tlingit-Haida | 99.6 /100 | #60 | Exceptional 4.4% |
| Okinawans | 99.6 /100 | #61 | Exceptional 4.4% |
| Immigrants | Australia | 99.6 /100 | #62 | Exceptional 4.4% |
| Immigrants | Sri Lanka | 99.6 /100 | #63 | Exceptional 4.4% |
| Immigrants | Bulgaria | 99.5 /100 | #64 | Exceptional 4.4% |
| Macedonians | 99.4 /100 | #65 | Exceptional 4.4% |
| Immigrants | Serbia | 99.4 /100 | #66 | Exceptional 4.4% |
| Immigrants | Canada | 99.4 /100 | #67 | Exceptional 4.4% |
| Slavs | 99.4 /100 | #68 | Exceptional 4.4% |