Guyanese vs Apache Currently Married
COMPARE
Guyanese
Apache
Currently Married
Currently Married Comparison
Guyanese
Apache
41.6%
CURRENTLY MARRIED
0.0/ 100
METRIC RATING
310th/ 347
METRIC RANK
43.2%
CURRENTLY MARRIED
0.0/ 100
METRIC RATING
280th/ 347
METRIC RANK
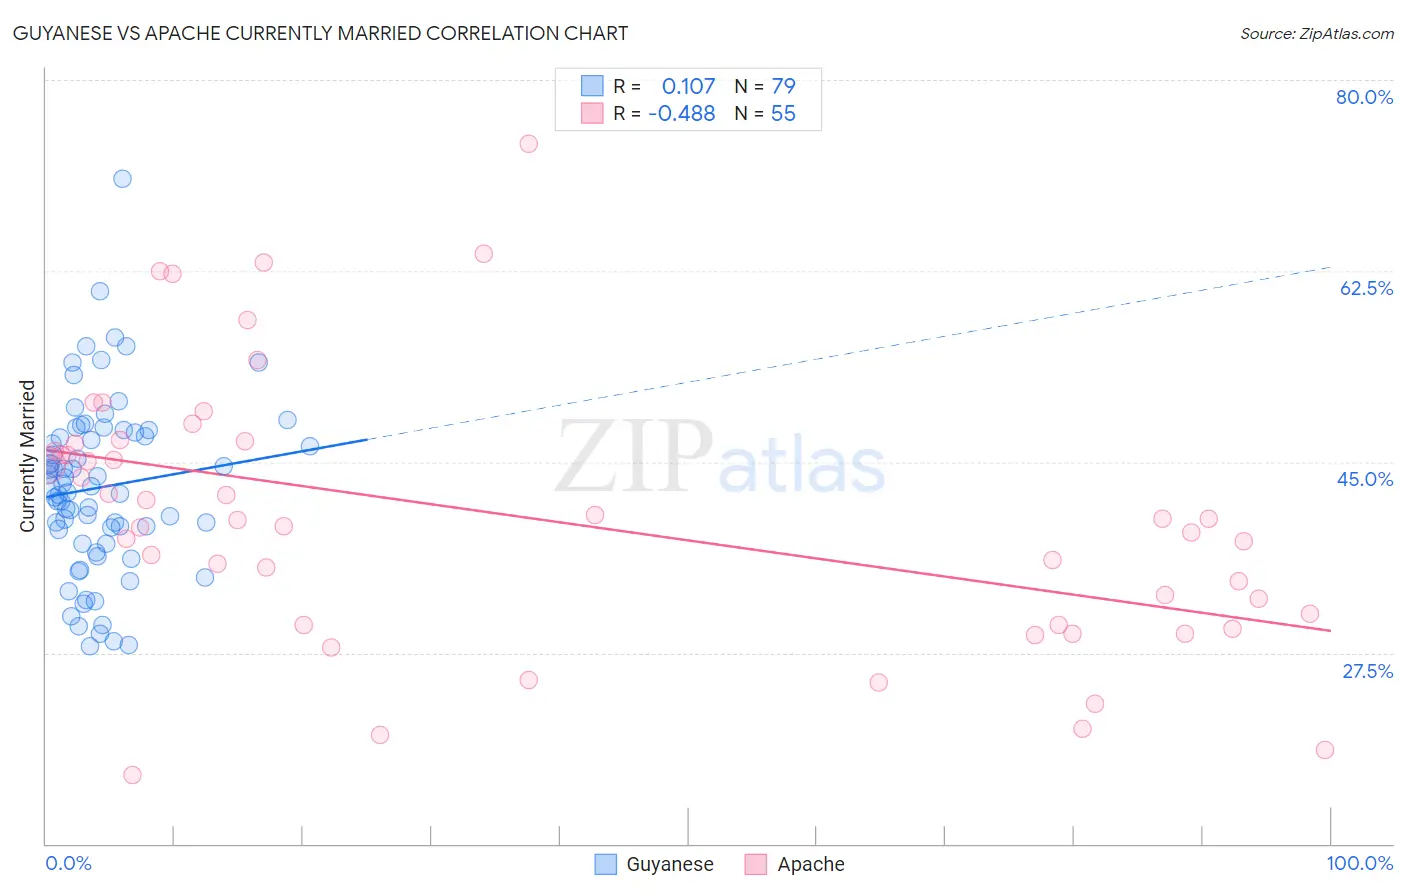
Guyanese vs Apache Currently Married Correlation Chart
The statistical analysis conducted on geographies consisting of 176,911,764 people shows a poor positive correlation between the proportion of Guyanese and percentage of population currently married in the United States with a correlation coefficient (R) of 0.107 and weighted average of 41.6%. Similarly, the statistical analysis conducted on geographies consisting of 231,125,444 people shows a moderate negative correlation between the proportion of Apache and percentage of population currently married in the United States with a correlation coefficient (R) of -0.488 and weighted average of 43.2%, a difference of 3.9%.
Currently Married Correlation Summary
| Measurement | Guyanese | Apache |
| Minimum | 28.1% | 16.3% |
| Maximum | 71.0% | 74.2% |
| Range | 42.9% | 57.9% |
| Mean | 42.7% | 40.0% |
| Median | 42.8% | 39.7% |
| Interquartile 25% (IQ1) | 37.5% | 30.0% |
| Interquartile 75% (IQ3) | 47.7% | 46.7% |
| Interquartile Range (IQR) | 10.2% | 16.7% |
| Standard Deviation (Sample) | 7.9% | 12.3% |
| Standard Deviation (Population) | 7.9% | 12.2% |
Similar Demographics by Currently Married
Demographics Similar to Guyanese by Currently Married
In terms of currently married, the demographic groups most similar to Guyanese are Trinidadian and Tobagonian (41.5%, a difference of 0.15%), Somali (41.5%, a difference of 0.33%), Immigrants from Liberia (41.8%, a difference of 0.36%), Immigrants from Belize (41.8%, a difference of 0.48%), and African (41.8%, a difference of 0.52%).
| Demographics | Rating | Rank | Currently Married |
| Sioux | 0.0 /100 | #303 | Tragic 41.9% |
| Immigrants | Bahamas | 0.0 /100 | #304 | Tragic 41.9% |
| Immigrants | Trinidad and Tobago | 0.0 /100 | #305 | Tragic 41.9% |
| Immigrants | Guyana | 0.0 /100 | #306 | Tragic 41.9% |
| Africans | 0.0 /100 | #307 | Tragic 41.8% |
| Immigrants | Belize | 0.0 /100 | #308 | Tragic 41.8% |
| Immigrants | Liberia | 0.0 /100 | #309 | Tragic 41.8% |
| Guyanese | 0.0 /100 | #310 | Tragic 41.6% |
| Trinidadians and Tobagonians | 0.0 /100 | #311 | Tragic 41.5% |
| Somalis | 0.0 /100 | #312 | Tragic 41.5% |
| Jamaicans | 0.0 /100 | #313 | Tragic 41.4% |
| West Indians | 0.0 /100 | #314 | Tragic 41.3% |
| Inupiat | 0.0 /100 | #315 | Tragic 41.3% |
| Immigrants | Caribbean | 0.0 /100 | #316 | Tragic 41.3% |
| Haitians | 0.0 /100 | #317 | Tragic 41.3% |
Demographics Similar to Apache by Currently Married
In terms of currently married, the demographic groups most similar to Apache are Chippewa (43.2%, a difference of 0.010%), Central American Indian (43.3%, a difference of 0.080%), Immigrants from Ecuador (43.2%, a difference of 0.080%), Kiowa (43.2%, a difference of 0.19%), and Immigrants from El Salvador (43.1%, a difference of 0.20%).
| Demographics | Rating | Rank | Currently Married |
| Yaqui | 0.1 /100 | #273 | Tragic 43.4% |
| Nigerians | 0.1 /100 | #274 | Tragic 43.4% |
| Colville | 0.1 /100 | #275 | Tragic 43.4% |
| Sierra Leoneans | 0.1 /100 | #276 | Tragic 43.4% |
| Immigrants | Nigeria | 0.1 /100 | #277 | Tragic 43.4% |
| Central Americans | 0.0 /100 | #278 | Tragic 43.3% |
| Central American Indians | 0.0 /100 | #279 | Tragic 43.3% |
| Apache | 0.0 /100 | #280 | Tragic 43.2% |
| Chippewa | 0.0 /100 | #281 | Tragic 43.2% |
| Immigrants | Ecuador | 0.0 /100 | #282 | Tragic 43.2% |
| Kiowa | 0.0 /100 | #283 | Tragic 43.2% |
| Immigrants | El Salvador | 0.0 /100 | #284 | Tragic 43.1% |
| Immigrants | Middle Africa | 0.0 /100 | #285 | Tragic 43.0% |
| Ghanaians | 0.0 /100 | #286 | Tragic 42.9% |
| Guatemalans | 0.0 /100 | #287 | Tragic 42.9% |