Guyanese vs Immigrants from Sudan Single Mother Poverty
COMPARE
Guyanese
Immigrants from Sudan
Single Mother Poverty
Single Mother Poverty Comparison
Guyanese
Immigrants from Sudan
29.8%
SINGLE MOTHER POVERTY
12.8/ 100
METRIC RATING
211th/ 347
METRIC RANK
30.1%
SINGLE MOTHER POVERTY
6.5/ 100
METRIC RATING
224th/ 347
METRIC RANK
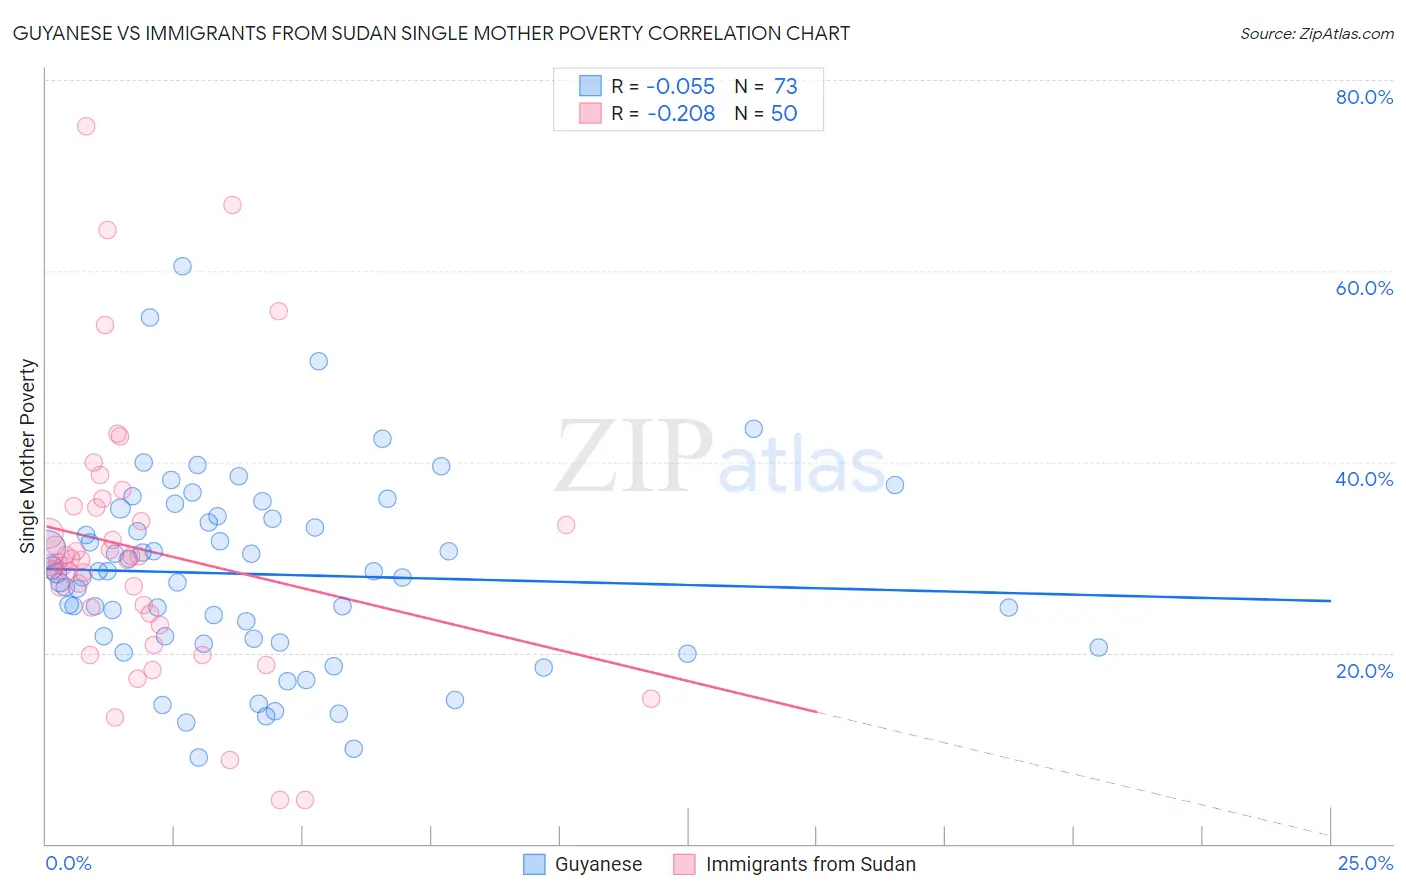
Guyanese vs Immigrants from Sudan Single Mother Poverty Correlation Chart
The statistical analysis conducted on geographies consisting of 174,134,686 people shows a slight negative correlation between the proportion of Guyanese and poverty level among single mothers in the United States with a correlation coefficient (R) of -0.055 and weighted average of 29.8%. Similarly, the statistical analysis conducted on geographies consisting of 118,210,366 people shows a weak negative correlation between the proportion of Immigrants from Sudan and poverty level among single mothers in the United States with a correlation coefficient (R) of -0.208 and weighted average of 30.1%, a difference of 0.87%.
Single Mother Poverty Correlation Summary
| Measurement | Guyanese | Immigrants from Sudan |
| Minimum | 9.1% | 4.5% |
| Maximum | 60.5% | 75.1% |
| Range | 51.4% | 70.6% |
| Mean | 28.2% | 30.8% |
| Median | 28.4% | 29.7% |
| Interquartile 25% (IQ1) | 21.3% | 24.1% |
| Interquartile 75% (IQ3) | 34.2% | 35.2% |
| Interquartile Range (IQR) | 12.9% | 11.1% |
| Standard Deviation (Sample) | 9.9% | 14.0% |
| Standard Deviation (Population) | 9.9% | 13.9% |
Demographics Similar to Guyanese and Immigrants from Sudan by Single Mother Poverty
In terms of single mother poverty, the demographic groups most similar to Guyanese are Nicaraguan (29.8%, a difference of 0.040%), Haitian (29.8%, a difference of 0.050%), Immigrants from Thailand (29.9%, a difference of 0.090%), Irish (29.8%, a difference of 0.11%), and Liberian (29.9%, a difference of 0.12%). Similarly, the demographic groups most similar to Immigrants from Sudan are Spanish (30.1%, a difference of 0.030%), Immigrants from Cuba (30.1%, a difference of 0.070%), Scottish (30.1%, a difference of 0.090%), Immigrants from Liberia (30.1%, a difference of 0.12%), and Sudanese (30.0%, a difference of 0.20%).
| Demographics | Rating | Rank | Single Mother Poverty |
| Immigrants | Panama | 15.5 /100 | #207 | Poor 29.8% |
| Immigrants | Guyana | 14.7 /100 | #208 | Poor 29.8% |
| Irish | 13.9 /100 | #209 | Poor 29.8% |
| Haitians | 13.3 /100 | #210 | Poor 29.8% |
| Guyanese | 12.8 /100 | #211 | Poor 29.8% |
| Nicaraguans | 12.4 /100 | #212 | Poor 29.8% |
| Immigrants | Thailand | 12.0 /100 | #213 | Poor 29.9% |
| Liberians | 11.7 /100 | #214 | Poor 29.9% |
| Jamaicans | 11.7 /100 | #215 | Poor 29.9% |
| Immigrants | Western Africa | 11.5 /100 | #216 | Poor 29.9% |
| Immigrants | Ghana | 11.3 /100 | #217 | Poor 29.9% |
| Hungarians | 10.3 /100 | #218 | Poor 29.9% |
| Finns | 9.3 /100 | #219 | Tragic 30.0% |
| Germans | 8.8 /100 | #220 | Tragic 30.0% |
| Immigrants | Eritrea | 7.7 /100 | #221 | Tragic 30.0% |
| Sudanese | 7.6 /100 | #222 | Tragic 30.0% |
| Immigrants | Cuba | 6.9 /100 | #223 | Tragic 30.1% |
| Immigrants | Sudan | 6.5 /100 | #224 | Tragic 30.1% |
| Spanish | 6.3 /100 | #225 | Tragic 30.1% |
| Scottish | 6.0 /100 | #226 | Tragic 30.1% |
| Immigrants | Liberia | 5.9 /100 | #227 | Tragic 30.1% |