Guyanese vs Apache Median Female Earnings
COMPARE
Guyanese
Apache
Median Female Earnings
Median Female Earnings Comparison
Guyanese
Apache
$40,973
MEDIAN FEMALE EARNINGS
93.4/ 100
METRIC RATING
123rd/ 347
METRIC RANK
$34,895
MEDIAN FEMALE EARNINGS
0.0/ 100
METRIC RATING
314th/ 347
METRIC RANK
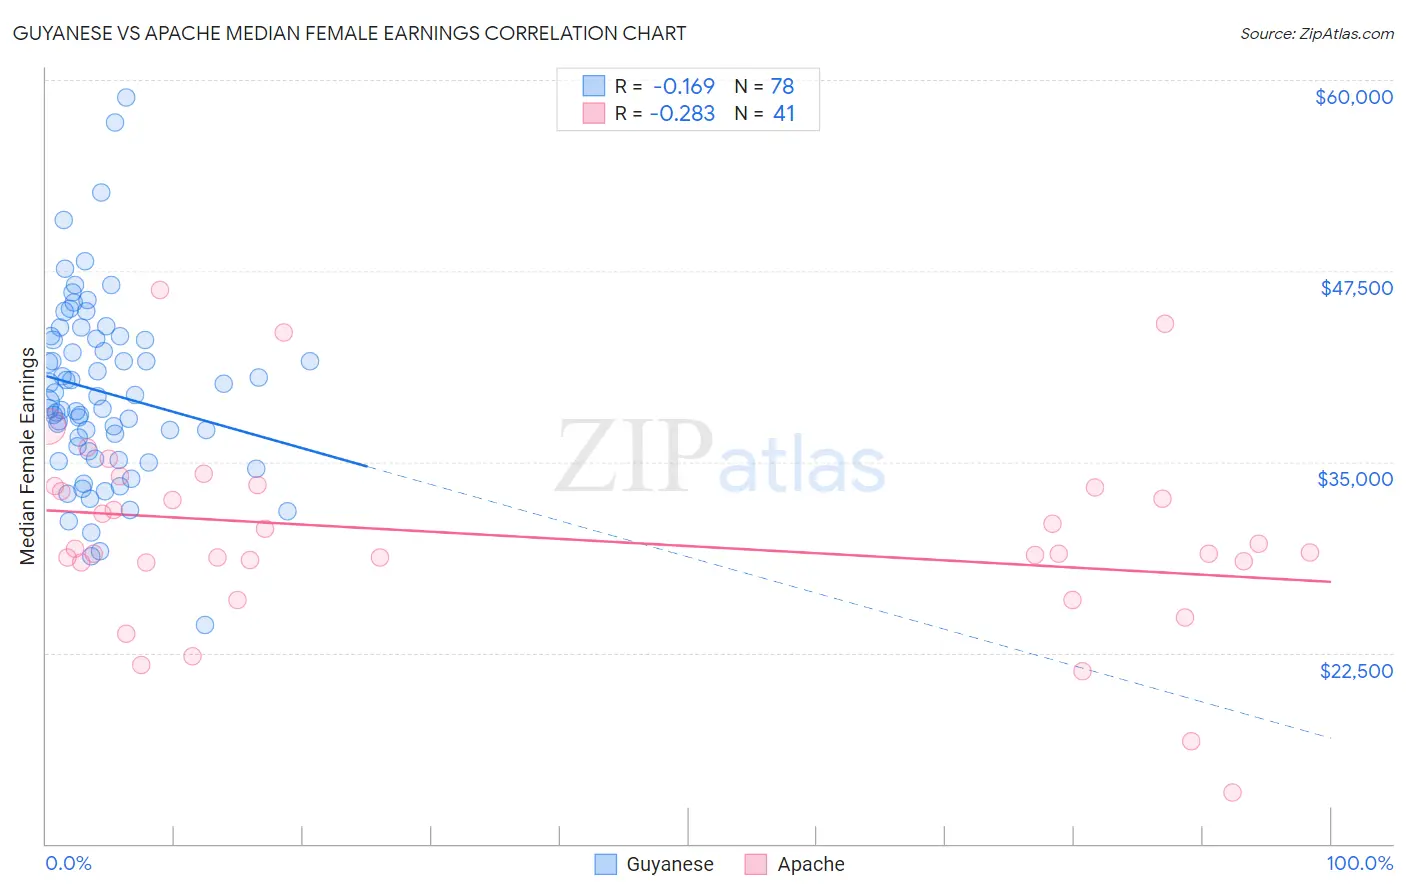
Guyanese vs Apache Median Female Earnings Correlation Chart
The statistical analysis conducted on geographies consisting of 176,910,004 people shows a poor negative correlation between the proportion of Guyanese and median female earnings in the United States with a correlation coefficient (R) of -0.169 and weighted average of $40,973. Similarly, the statistical analysis conducted on geographies consisting of 230,997,872 people shows a weak negative correlation between the proportion of Apache and median female earnings in the United States with a correlation coefficient (R) of -0.283 and weighted average of $34,895, a difference of 17.4%.
Median Female Earnings Correlation Summary
| Measurement | Guyanese | Apache |
| Minimum | $24,336 | $13,381 |
| Maximum | $58,839 | $46,250 |
| Range | $34,503 | $32,869 |
| Mean | $39,580 | $30,090 |
| Median | $39,093 | $29,044 |
| Interquartile 25% (IQ1) | $35,732 | $28,433 |
| Interquartile 75% (IQ3) | $43,057 | $33,369 |
| Interquartile Range (IQR) | $7,325 | $4,936 |
| Standard Deviation (Sample) | $6,016 | $6,387 |
| Standard Deviation (Population) | $5,977 | $6,309 |
Similar Demographics by Median Female Earnings
Demographics Similar to Guyanese by Median Female Earnings
In terms of median female earnings, the demographic groups most similar to Guyanese are Immigrants from Jordan ($40,977, a difference of 0.010%), Trinidadian and Tobagonian ($40,958, a difference of 0.040%), Croatian ($40,993, a difference of 0.050%), Austrian ($40,923, a difference of 0.12%), and Immigrants from Trinidad and Tobago ($40,895, a difference of 0.19%).
| Demographics | Rating | Rank | Median Female Earnings |
| Immigrants | Brazil | 96.4 /100 | #116 | Exceptional $41,273 |
| Barbadians | 96.3 /100 | #117 | Exceptional $41,261 |
| Immigrants | Lebanon | 95.6 /100 | #118 | Exceptional $41,183 |
| Immigrants | Philippines | 95.0 /100 | #119 | Exceptional $41,114 |
| Immigrants | Kuwait | 94.4 /100 | #120 | Exceptional $41,055 |
| Croatians | 93.7 /100 | #121 | Exceptional $40,993 |
| Immigrants | Jordan | 93.5 /100 | #122 | Exceptional $40,977 |
| Guyanese | 93.4 /100 | #123 | Exceptional $40,973 |
| Trinidadians and Tobagonians | 93.2 /100 | #124 | Exceptional $40,958 |
| Austrians | 92.7 /100 | #125 | Exceptional $40,923 |
| Immigrants | Trinidad and Tobago | 92.3 /100 | #126 | Exceptional $40,895 |
| Ugandans | 92.2 /100 | #127 | Exceptional $40,889 |
| Carpatho Rusyns | 91.2 /100 | #128 | Exceptional $40,825 |
| Zimbabweans | 90.8 /100 | #129 | Exceptional $40,798 |
| Immigrants | Guyana | 90.3 /100 | #130 | Exceptional $40,773 |
Demographics Similar to Apache by Median Female Earnings
In terms of median female earnings, the demographic groups most similar to Apache are Cuban ($34,942, a difference of 0.13%), Yaqui ($34,943, a difference of 0.14%), Ute ($34,960, a difference of 0.19%), Pennsylvania German ($34,802, a difference of 0.27%), and Chippewa ($35,003, a difference of 0.31%).
| Demographics | Rating | Rank | Median Female Earnings |
| Sioux | 0.0 /100 | #307 | Tragic $35,063 |
| Immigrants | Bahamas | 0.0 /100 | #308 | Tragic $35,027 |
| Hondurans | 0.0 /100 | #309 | Tragic $35,013 |
| Chippewa | 0.0 /100 | #310 | Tragic $35,003 |
| Ute | 0.0 /100 | #311 | Tragic $34,960 |
| Yaqui | 0.0 /100 | #312 | Tragic $34,943 |
| Cubans | 0.0 /100 | #313 | Tragic $34,942 |
| Apache | 0.0 /100 | #314 | Tragic $34,895 |
| Pennsylvania Germans | 0.0 /100 | #315 | Tragic $34,802 |
| Cherokee | 0.0 /100 | #316 | Tragic $34,742 |
| Potawatomi | 0.0 /100 | #317 | Tragic $34,739 |
| Immigrants | Yemen | 0.0 /100 | #318 | Tragic $34,693 |
| Shoshone | 0.0 /100 | #319 | Tragic $34,677 |
| Immigrants | Honduras | 0.0 /100 | #320 | Tragic $34,647 |
| Hispanics or Latinos | 0.0 /100 | #321 | Tragic $34,421 |