Guyanese vs Immigrants from Netherlands Single Mother Poverty
COMPARE
Guyanese
Immigrants from Netherlands
Single Mother Poverty
Single Mother Poverty Comparison
Guyanese
Immigrants from Netherlands
29.8%
SINGLE MOTHER POVERTY
12.8/ 100
METRIC RATING
211th/ 347
METRIC RANK
27.9%
SINGLE MOTHER POVERTY
97.2/ 100
METRIC RATING
99th/ 347
METRIC RANK
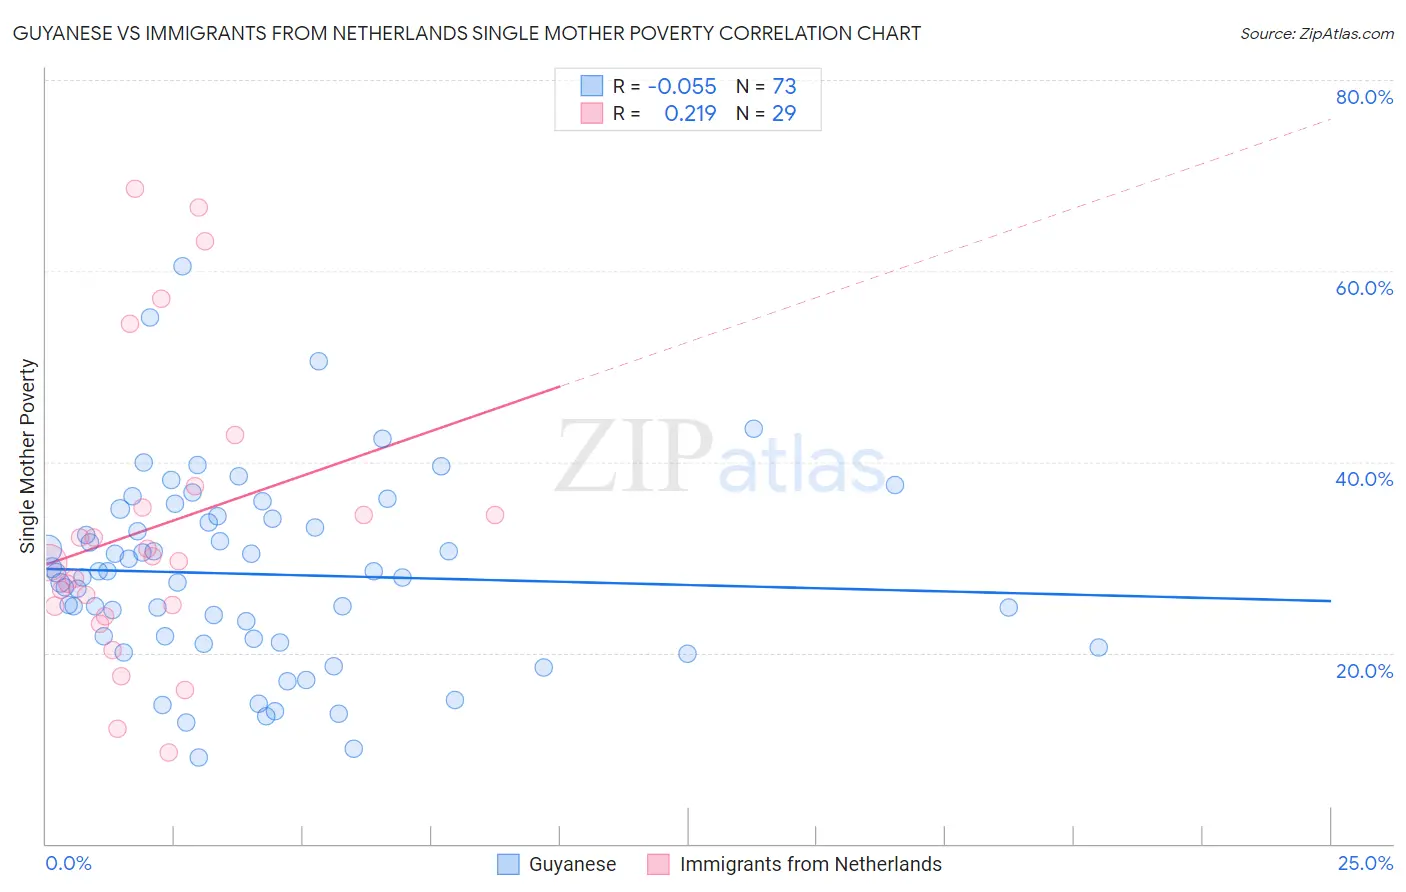
Guyanese vs Immigrants from Netherlands Single Mother Poverty Correlation Chart
The statistical analysis conducted on geographies consisting of 174,134,686 people shows a slight negative correlation between the proportion of Guyanese and poverty level among single mothers in the United States with a correlation coefficient (R) of -0.055 and weighted average of 29.8%. Similarly, the statistical analysis conducted on geographies consisting of 233,130,258 people shows a weak positive correlation between the proportion of Immigrants from Netherlands and poverty level among single mothers in the United States with a correlation coefficient (R) of 0.219 and weighted average of 27.9%, a difference of 6.8%.
Single Mother Poverty Correlation Summary
| Measurement | Guyanese | Immigrants from Netherlands |
| Minimum | 9.1% | 9.6% |
| Maximum | 60.5% | 68.6% |
| Range | 51.4% | 59.0% |
| Mean | 28.2% | 33.1% |
| Median | 28.4% | 29.6% |
| Interquartile 25% (IQ1) | 21.3% | 24.3% |
| Interquartile 75% (IQ3) | 34.2% | 36.4% |
| Interquartile Range (IQR) | 12.9% | 12.0% |
| Standard Deviation (Sample) | 9.9% | 15.4% |
| Standard Deviation (Population) | 9.9% | 15.1% |
Similar Demographics by Single Mother Poverty
Demographics Similar to Guyanese by Single Mother Poverty
In terms of single mother poverty, the demographic groups most similar to Guyanese are Nicaraguan (29.8%, a difference of 0.040%), Haitian (29.8%, a difference of 0.050%), Immigrants from Thailand (29.9%, a difference of 0.090%), Irish (29.8%, a difference of 0.11%), and Liberian (29.9%, a difference of 0.12%).
| Demographics | Rating | Rank | Single Mother Poverty |
| Immigrants | Immigrants | 16.6 /100 | #204 | Poor 29.7% |
| Czechoslovakians | 16.1 /100 | #205 | Poor 29.7% |
| Immigrants | Haiti | 15.8 /100 | #206 | Poor 29.7% |
| Immigrants | Panama | 15.5 /100 | #207 | Poor 29.8% |
| Immigrants | Guyana | 14.7 /100 | #208 | Poor 29.8% |
| Irish | 13.9 /100 | #209 | Poor 29.8% |
| Haitians | 13.3 /100 | #210 | Poor 29.8% |
| Guyanese | 12.8 /100 | #211 | Poor 29.8% |
| Nicaraguans | 12.4 /100 | #212 | Poor 29.8% |
| Immigrants | Thailand | 12.0 /100 | #213 | Poor 29.9% |
| Liberians | 11.7 /100 | #214 | Poor 29.9% |
| Jamaicans | 11.7 /100 | #215 | Poor 29.9% |
| Immigrants | Western Africa | 11.5 /100 | #216 | Poor 29.9% |
| Immigrants | Ghana | 11.3 /100 | #217 | Poor 29.9% |
| Hungarians | 10.3 /100 | #218 | Poor 29.9% |
Demographics Similar to Immigrants from Netherlands by Single Mother Poverty
In terms of single mother poverty, the demographic groups most similar to Immigrants from Netherlands are Immigrants from Nepal (27.9%, a difference of 0.010%), Immigrants from Brazil (27.9%, a difference of 0.020%), Zimbabwean (27.9%, a difference of 0.050%), Immigrants from Iraq (27.9%, a difference of 0.060%), and Pakistani (28.0%, a difference of 0.11%).
| Demographics | Rating | Rank | Single Mother Poverty |
| Estonians | 97.9 /100 | #92 | Exceptional 27.8% |
| Romanians | 97.8 /100 | #93 | Exceptional 27.8% |
| Albanians | 97.6 /100 | #94 | Exceptional 27.9% |
| Chileans | 97.5 /100 | #95 | Exceptional 27.9% |
| Immigrants | Iraq | 97.3 /100 | #96 | Exceptional 27.9% |
| Immigrants | Brazil | 97.2 /100 | #97 | Exceptional 27.9% |
| Immigrants | Nepal | 97.2 /100 | #98 | Exceptional 27.9% |
| Immigrants | Netherlands | 97.2 /100 | #99 | Exceptional 27.9% |
| Zimbabweans | 97.1 /100 | #100 | Exceptional 27.9% |
| Pakistanis | 96.9 /100 | #101 | Exceptional 28.0% |
| Immigrants | Croatia | 96.7 /100 | #102 | Exceptional 28.0% |
| Immigrants | Northern Africa | 96.6 /100 | #103 | Exceptional 28.0% |
| Italians | 96.6 /100 | #104 | Exceptional 28.0% |
| Israelis | 96.5 /100 | #105 | Exceptional 28.0% |
| Ukrainians | 96.4 /100 | #106 | Exceptional 28.0% |