Guyanese vs Immigrants from Uganda Single Mother Poverty
COMPARE
Guyanese
Immigrants from Uganda
Single Mother Poverty
Single Mother Poverty Comparison
Guyanese
Immigrants from Uganda
29.8%
SINGLE MOTHER POVERTY
12.8/ 100
METRIC RATING
211th/ 347
METRIC RANK
28.3%
SINGLE MOTHER POVERTY
92.5/ 100
METRIC RATING
116th/ 347
METRIC RANK
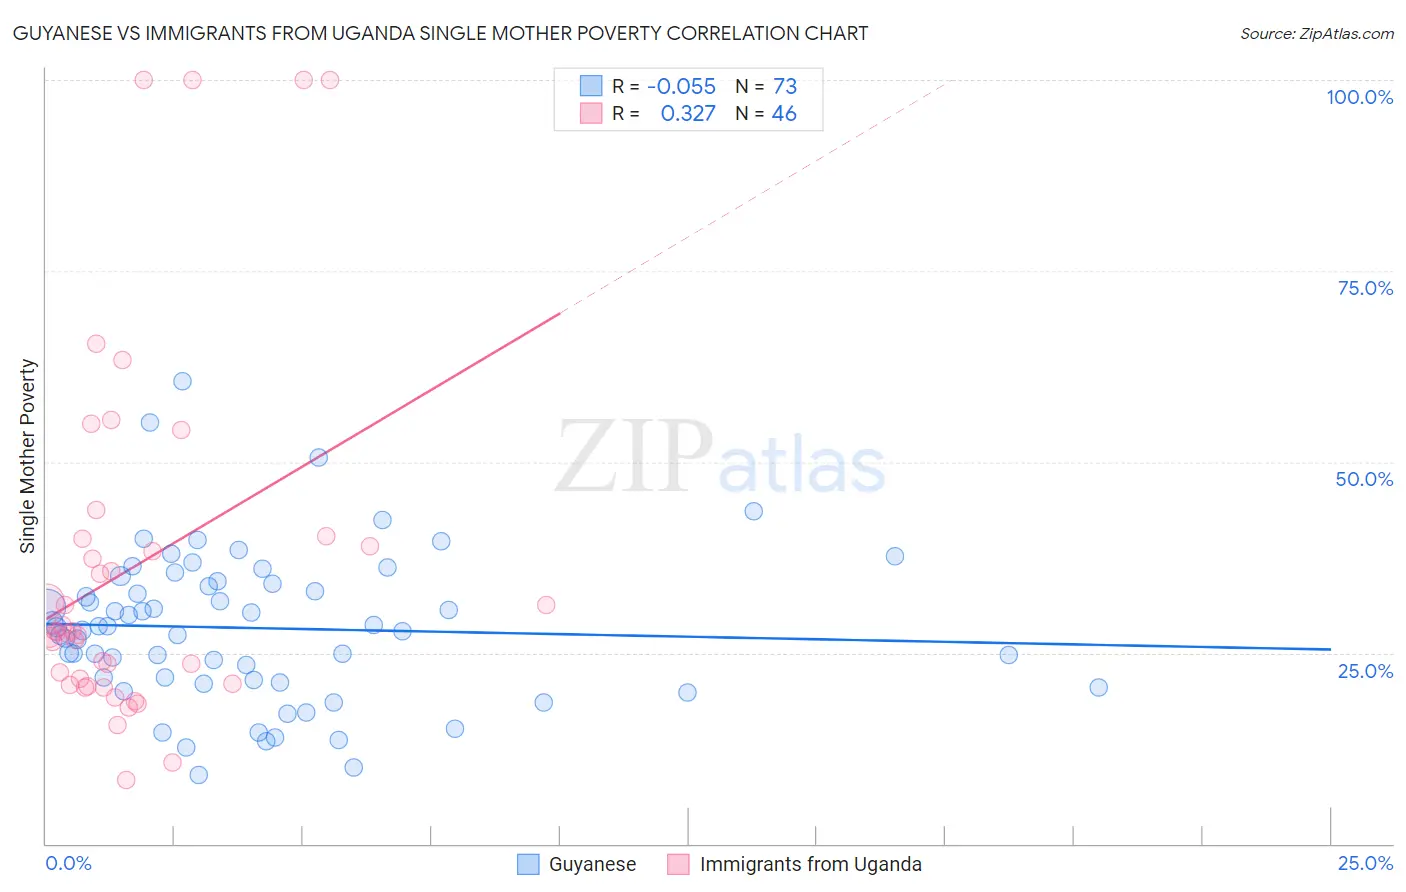
Guyanese vs Immigrants from Uganda Single Mother Poverty Correlation Chart
The statistical analysis conducted on geographies consisting of 174,134,686 people shows a slight negative correlation between the proportion of Guyanese and poverty level among single mothers in the United States with a correlation coefficient (R) of -0.055 and weighted average of 29.8%. Similarly, the statistical analysis conducted on geographies consisting of 125,043,524 people shows a mild positive correlation between the proportion of Immigrants from Uganda and poverty level among single mothers in the United States with a correlation coefficient (R) of 0.327 and weighted average of 28.3%, a difference of 5.5%.
Single Mother Poverty Correlation Summary
| Measurement | Guyanese | Immigrants from Uganda |
| Minimum | 9.1% | 8.4% |
| Maximum | 60.5% | 100.0% |
| Range | 51.4% | 91.6% |
| Mean | 28.2% | 36.3% |
| Median | 28.4% | 27.8% |
| Interquartile 25% (IQ1) | 21.3% | 21.0% |
| Interquartile 75% (IQ3) | 34.2% | 40.0% |
| Interquartile Range (IQR) | 12.9% | 19.0% |
| Standard Deviation (Sample) | 9.9% | 23.6% |
| Standard Deviation (Population) | 9.9% | 23.3% |
Similar Demographics by Single Mother Poverty
Demographics Similar to Guyanese by Single Mother Poverty
In terms of single mother poverty, the demographic groups most similar to Guyanese are Nicaraguan (29.8%, a difference of 0.040%), Haitian (29.8%, a difference of 0.050%), Immigrants from Thailand (29.9%, a difference of 0.090%), Irish (29.8%, a difference of 0.11%), and Liberian (29.9%, a difference of 0.12%).
| Demographics | Rating | Rank | Single Mother Poverty |
| Immigrants | Immigrants | 16.6 /100 | #204 | Poor 29.7% |
| Czechoslovakians | 16.1 /100 | #205 | Poor 29.7% |
| Immigrants | Haiti | 15.8 /100 | #206 | Poor 29.7% |
| Immigrants | Panama | 15.5 /100 | #207 | Poor 29.8% |
| Immigrants | Guyana | 14.7 /100 | #208 | Poor 29.8% |
| Irish | 13.9 /100 | #209 | Poor 29.8% |
| Haitians | 13.3 /100 | #210 | Poor 29.8% |
| Guyanese | 12.8 /100 | #211 | Poor 29.8% |
| Nicaraguans | 12.4 /100 | #212 | Poor 29.8% |
| Immigrants | Thailand | 12.0 /100 | #213 | Poor 29.9% |
| Liberians | 11.7 /100 | #214 | Poor 29.9% |
| Jamaicans | 11.7 /100 | #215 | Poor 29.9% |
| Immigrants | Western Africa | 11.5 /100 | #216 | Poor 29.9% |
| Immigrants | Ghana | 11.3 /100 | #217 | Poor 29.9% |
| Hungarians | 10.3 /100 | #218 | Poor 29.9% |
Demographics Similar to Immigrants from Uganda by Single Mother Poverty
In terms of single mother poverty, the demographic groups most similar to Immigrants from Uganda are Australian (28.3%, a difference of 0.010%), Immigrants from Kuwait (28.3%, a difference of 0.020%), Brazilian (28.3%, a difference of 0.020%), Immigrants from Western Asia (28.3%, a difference of 0.030%), and Immigrants from Syria (28.3%, a difference of 0.030%).
| Demographics | Rating | Rank | Single Mother Poverty |
| Immigrants | Armenia | 95.2 /100 | #109 | Exceptional 28.1% |
| Croatians | 94.8 /100 | #110 | Exceptional 28.2% |
| Venezuelans | 94.5 /100 | #111 | Exceptional 28.2% |
| Immigrants | Kazakhstan | 94.5 /100 | #112 | Exceptional 28.2% |
| Immigrants | South Africa | 93.2 /100 | #113 | Exceptional 28.3% |
| Immigrants | Western Asia | 92.7 /100 | #114 | Exceptional 28.3% |
| Immigrants | Kuwait | 92.7 /100 | #115 | Exceptional 28.3% |
| Immigrants | Uganda | 92.5 /100 | #116 | Exceptional 28.3% |
| Australians | 92.5 /100 | #117 | Exceptional 28.3% |
| Brazilians | 92.4 /100 | #118 | Exceptional 28.3% |
| Immigrants | Syria | 92.4 /100 | #119 | Exceptional 28.3% |
| Cypriots | 92.3 /100 | #120 | Exceptional 28.3% |
| Immigrants | Afghanistan | 92.1 /100 | #121 | Exceptional 28.3% |
| Colombians | 91.8 /100 | #122 | Exceptional 28.3% |
| Uruguayans | 91.7 /100 | #123 | Exceptional 28.3% |