Guyanese vs Macedonian Single Mother Poverty
COMPARE
Guyanese
Macedonian
Single Mother Poverty
Single Mother Poverty Comparison
Guyanese
Macedonians
29.8%
SINGLE MOTHER POVERTY
12.8/ 100
METRIC RATING
211th/ 347
METRIC RANK
27.4%
SINGLE MOTHER POVERTY
99.4/ 100
METRIC RATING
71st/ 347
METRIC RANK
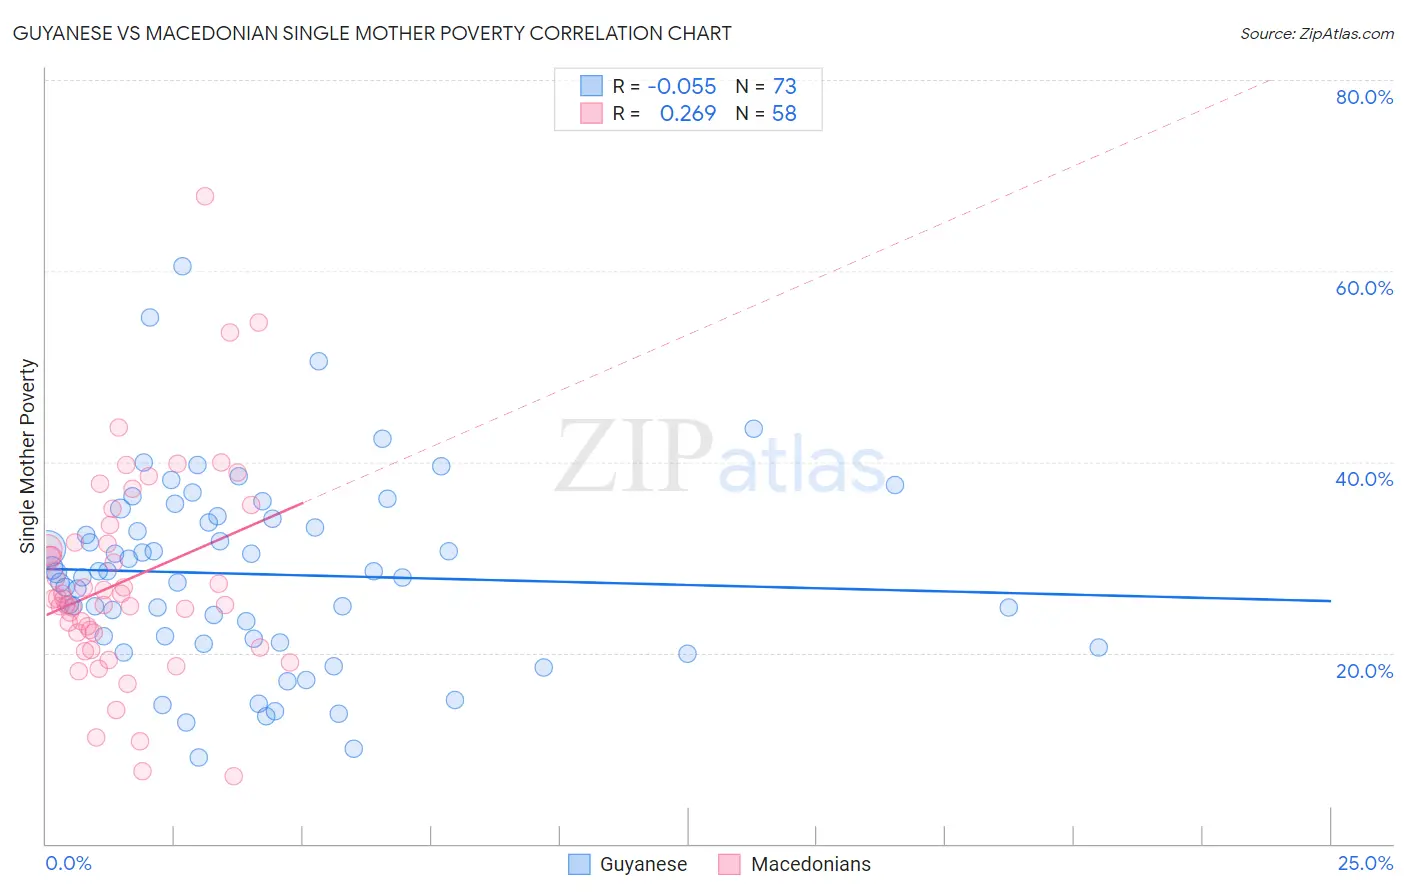
Guyanese vs Macedonian Single Mother Poverty Correlation Chart
The statistical analysis conducted on geographies consisting of 174,134,686 people shows a slight negative correlation between the proportion of Guyanese and poverty level among single mothers in the United States with a correlation coefficient (R) of -0.055 and weighted average of 29.8%. Similarly, the statistical analysis conducted on geographies consisting of 130,650,018 people shows a weak positive correlation between the proportion of Macedonians and poverty level among single mothers in the United States with a correlation coefficient (R) of 0.269 and weighted average of 27.4%, a difference of 8.9%.
Single Mother Poverty Correlation Summary
| Measurement | Guyanese | Macedonian |
| Minimum | 9.1% | 7.0% |
| Maximum | 60.5% | 67.8% |
| Range | 51.4% | 60.8% |
| Mean | 28.2% | 27.6% |
| Median | 28.4% | 25.7% |
| Interquartile 25% (IQ1) | 21.3% | 22.1% |
| Interquartile 75% (IQ3) | 34.2% | 31.6% |
| Interquartile Range (IQR) | 12.9% | 9.5% |
| Standard Deviation (Sample) | 9.9% | 11.0% |
| Standard Deviation (Population) | 9.9% | 10.9% |
Similar Demographics by Single Mother Poverty
Demographics Similar to Guyanese by Single Mother Poverty
In terms of single mother poverty, the demographic groups most similar to Guyanese are Nicaraguan (29.8%, a difference of 0.040%), Haitian (29.8%, a difference of 0.050%), Immigrants from Thailand (29.9%, a difference of 0.090%), Irish (29.8%, a difference of 0.11%), and Liberian (29.9%, a difference of 0.12%).
| Demographics | Rating | Rank | Single Mother Poverty |
| Immigrants | Immigrants | 16.6 /100 | #204 | Poor 29.7% |
| Czechoslovakians | 16.1 /100 | #205 | Poor 29.7% |
| Immigrants | Haiti | 15.8 /100 | #206 | Poor 29.7% |
| Immigrants | Panama | 15.5 /100 | #207 | Poor 29.8% |
| Immigrants | Guyana | 14.7 /100 | #208 | Poor 29.8% |
| Irish | 13.9 /100 | #209 | Poor 29.8% |
| Haitians | 13.3 /100 | #210 | Poor 29.8% |
| Guyanese | 12.8 /100 | #211 | Poor 29.8% |
| Nicaraguans | 12.4 /100 | #212 | Poor 29.8% |
| Immigrants | Thailand | 12.0 /100 | #213 | Poor 29.9% |
| Liberians | 11.7 /100 | #214 | Poor 29.9% |
| Jamaicans | 11.7 /100 | #215 | Poor 29.9% |
| Immigrants | Western Africa | 11.5 /100 | #216 | Poor 29.9% |
| Immigrants | Ghana | 11.3 /100 | #217 | Poor 29.9% |
| Hungarians | 10.3 /100 | #218 | Poor 29.9% |
Demographics Similar to Macedonians by Single Mother Poverty
In terms of single mother poverty, the demographic groups most similar to Macedonians are Immigrants from Belarus (27.4%, a difference of 0.020%), Immigrants from Russia (27.4%, a difference of 0.020%), Lithuanian (27.4%, a difference of 0.030%), Sierra Leonean (27.4%, a difference of 0.090%), and Immigrants from Europe (27.4%, a difference of 0.15%).
| Demographics | Rating | Rank | Single Mother Poverty |
| Russians | 99.5 /100 | #64 | Exceptional 27.3% |
| Immigrants | Turkey | 99.5 /100 | #65 | Exceptional 27.3% |
| Soviet Union | 99.5 /100 | #66 | Exceptional 27.3% |
| Immigrants | Australia | 99.5 /100 | #67 | Exceptional 27.3% |
| Immigrants | Czechoslovakia | 99.5 /100 | #68 | Exceptional 27.4% |
| Lithuanians | 99.4 /100 | #69 | Exceptional 27.4% |
| Immigrants | Belarus | 99.4 /100 | #70 | Exceptional 27.4% |
| Macedonians | 99.4 /100 | #71 | Exceptional 27.4% |
| Immigrants | Russia | 99.4 /100 | #72 | Exceptional 27.4% |
| Sierra Leoneans | 99.3 /100 | #73 | Exceptional 27.4% |
| Immigrants | Europe | 99.3 /100 | #74 | Exceptional 27.4% |
| Immigrants | Sweden | 99.2 /100 | #75 | Exceptional 27.5% |
| Peruvians | 99.2 /100 | #76 | Exceptional 27.5% |
| Immigrants | Peru | 99.2 /100 | #77 | Exceptional 27.5% |
| Immigrants | North Macedonia | 99.2 /100 | #78 | Exceptional 27.5% |