Guyanese vs Apache Male Disability
COMPARE
Guyanese
Apache
Male Disability
Male Disability Comparison
Guyanese
Apache
10.5%
MALE DISABILITY
99.2/ 100
METRIC RATING
66th/ 347
METRIC RANK
14.0%
MALE DISABILITY
0.0/ 100
METRIC RATING
322nd/ 347
METRIC RANK
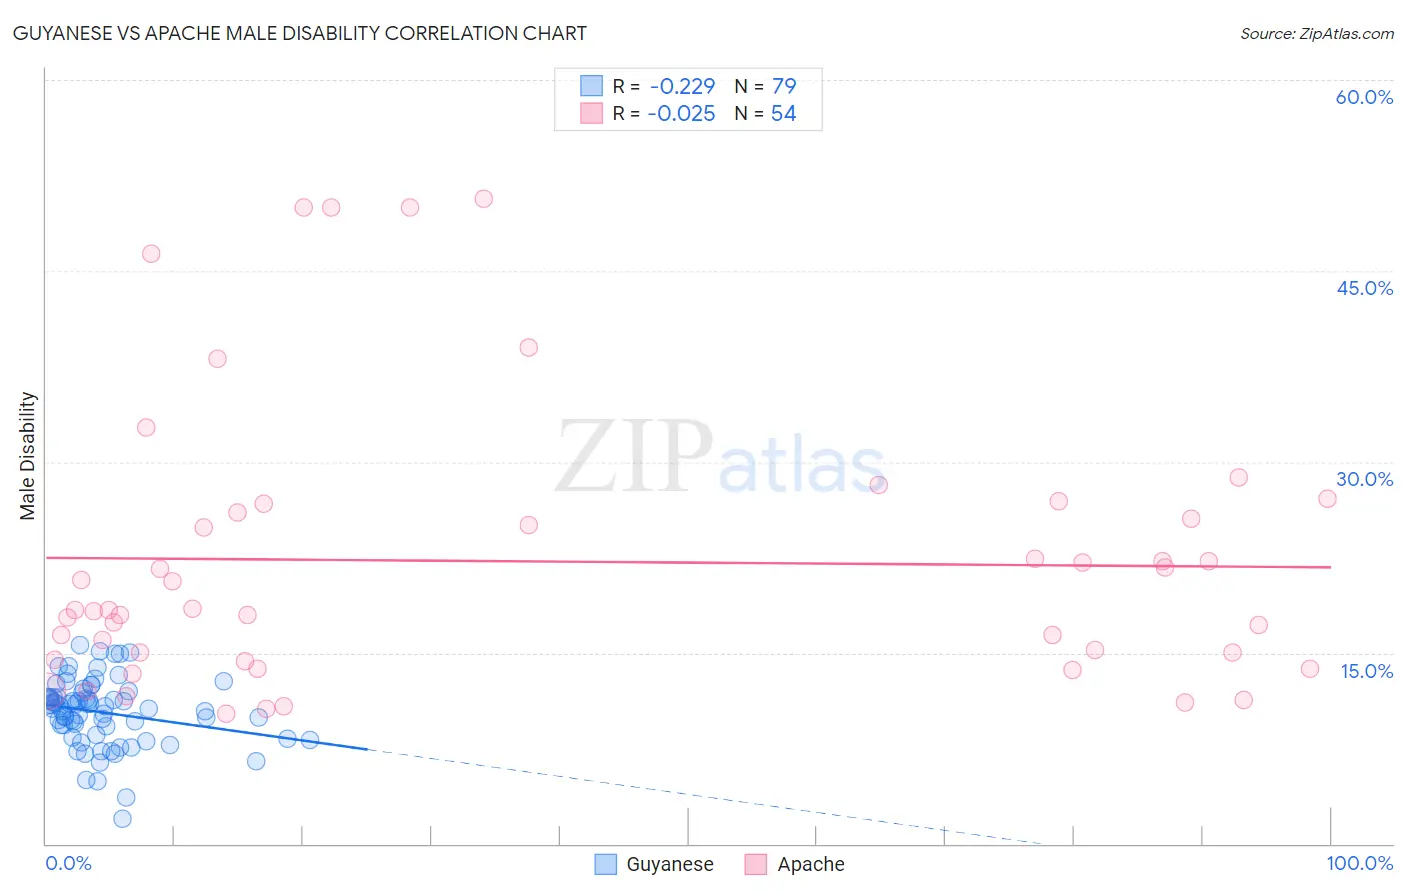
Guyanese vs Apache Male Disability Correlation Chart
The statistical analysis conducted on geographies consisting of 176,893,996 people shows a weak negative correlation between the proportion of Guyanese and percentage of males with a disability in the United States with a correlation coefficient (R) of -0.229 and weighted average of 10.5%. Similarly, the statistical analysis conducted on geographies consisting of 231,062,399 people shows no correlation between the proportion of Apache and percentage of males with a disability in the United States with a correlation coefficient (R) of -0.025 and weighted average of 14.0%, a difference of 33.8%.
Male Disability Correlation Summary
| Measurement | Guyanese | Apache |
| Minimum | 2.0% | 10.2% |
| Maximum | 15.6% | 50.7% |
| Range | 13.6% | 40.5% |
| Mean | 10.3% | 22.2% |
| Median | 10.8% | 18.3% |
| Interquartile 25% (IQ1) | 8.5% | 14.5% |
| Interquartile 75% (IQ3) | 11.5% | 26.0% |
| Interquartile Range (IQR) | 3.0% | 11.6% |
| Standard Deviation (Sample) | 2.6% | 11.0% |
| Standard Deviation (Population) | 2.6% | 10.9% |
Similar Demographics by Male Disability
Demographics Similar to Guyanese by Male Disability
In terms of male disability, the demographic groups most similar to Guyanese are Immigrants from Grenada (10.5%, a difference of 0.0%), Immigrants from Afghanistan (10.5%, a difference of 0.010%), Jordanian (10.5%, a difference of 0.030%), Colombian (10.5%, a difference of 0.10%), and Ecuadorian (10.5%, a difference of 0.11%).
| Demographics | Rating | Rank | Male Disability |
| Immigrants | Australia | 99.5 /100 | #59 | Exceptional 10.4% |
| Immigrants | Colombia | 99.5 /100 | #60 | Exceptional 10.4% |
| Immigrants | Northern Africa | 99.4 /100 | #61 | Exceptional 10.4% |
| Immigrants | Ecuador | 99.3 /100 | #62 | Exceptional 10.4% |
| Immigrants | Belarus | 99.3 /100 | #63 | Exceptional 10.4% |
| Jordanians | 99.3 /100 | #64 | Exceptional 10.5% |
| Immigrants | Grenada | 99.2 /100 | #65 | Exceptional 10.5% |
| Guyanese | 99.2 /100 | #66 | Exceptional 10.5% |
| Immigrants | Afghanistan | 99.2 /100 | #67 | Exceptional 10.5% |
| Colombians | 99.2 /100 | #68 | Exceptional 10.5% |
| Ecuadorians | 99.2 /100 | #69 | Exceptional 10.5% |
| Immigrants | Bulgaria | 99.1 /100 | #70 | Exceptional 10.5% |
| Immigrants | Cameroon | 99.0 /100 | #71 | Exceptional 10.5% |
| Immigrants | Serbia | 99.0 /100 | #72 | Exceptional 10.5% |
| Immigrants | Lithuania | 98.9 /100 | #73 | Exceptional 10.5% |
Demographics Similar to Apache by Male Disability
In terms of male disability, the demographic groups most similar to Apache are Osage (14.0%, a difference of 0.070%), Comanche (14.1%, a difference of 0.40%), Ottawa (14.1%, a difference of 0.51%), Shoshone (13.8%, a difference of 1.1%), and Tlingit-Haida (13.8%, a difference of 1.2%).
| Demographics | Rating | Rank | Male Disability |
| Iroquois | 0.0 /100 | #315 | Tragic 13.6% |
| Alaska Natives | 0.0 /100 | #316 | Tragic 13.6% |
| Paiute | 0.0 /100 | #317 | Tragic 13.7% |
| Cree | 0.0 /100 | #318 | Tragic 13.7% |
| Americans | 0.0 /100 | #319 | Tragic 13.8% |
| Tlingit-Haida | 0.0 /100 | #320 | Tragic 13.8% |
| Shoshone | 0.0 /100 | #321 | Tragic 13.8% |
| Apache | 0.0 /100 | #322 | Tragic 14.0% |
| Osage | 0.0 /100 | #323 | Tragic 14.0% |
| Comanche | 0.0 /100 | #324 | Tragic 14.1% |
| Ottawa | 0.0 /100 | #325 | Tragic 14.1% |
| Natives/Alaskans | 0.0 /100 | #326 | Tragic 14.2% |
| Potawatomi | 0.0 /100 | #327 | Tragic 14.2% |
| Chippewa | 0.0 /100 | #328 | Tragic 14.3% |
| Cajuns | 0.0 /100 | #329 | Tragic 14.4% |