Guyanese vs Immigrants from Switzerland Single Mother Poverty
COMPARE
Guyanese
Immigrants from Switzerland
Single Mother Poverty
Single Mother Poverty Comparison
Guyanese
Immigrants from Switzerland
29.8%
SINGLE MOTHER POVERTY
12.8/ 100
METRIC RATING
211th/ 347
METRIC RANK
28.3%
SINGLE MOTHER POVERTY
91.7/ 100
METRIC RATING
124th/ 347
METRIC RANK
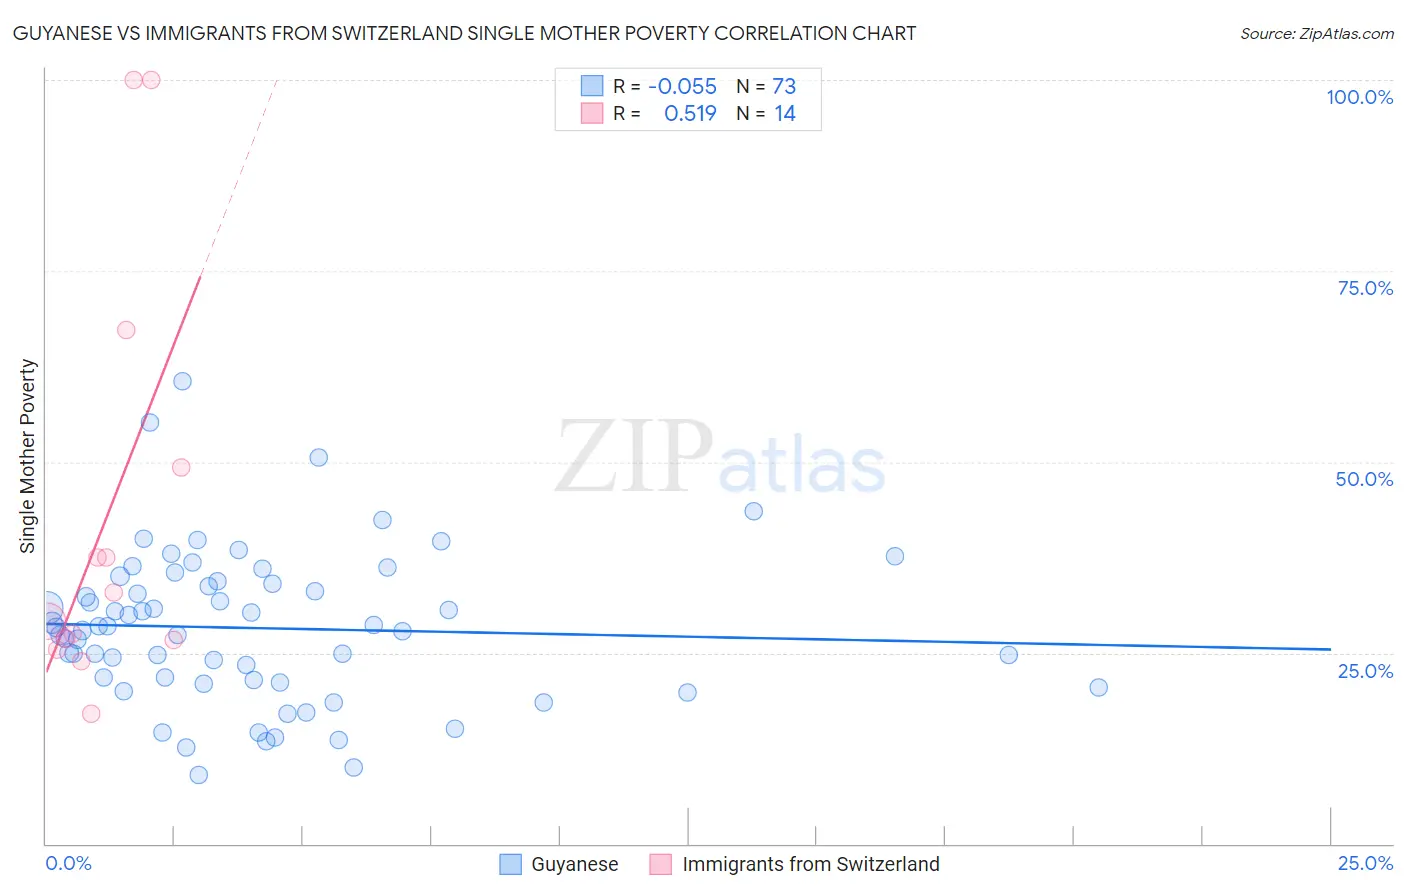
Guyanese vs Immigrants from Switzerland Single Mother Poverty Correlation Chart
The statistical analysis conducted on geographies consisting of 174,134,686 people shows a slight negative correlation between the proportion of Guyanese and poverty level among single mothers in the United States with a correlation coefficient (R) of -0.055 and weighted average of 29.8%. Similarly, the statistical analysis conducted on geographies consisting of 145,488,343 people shows a substantial positive correlation between the proportion of Immigrants from Switzerland and poverty level among single mothers in the United States with a correlation coefficient (R) of 0.519 and weighted average of 28.3%, a difference of 5.3%.
Single Mother Poverty Correlation Summary
| Measurement | Guyanese | Immigrants from Switzerland |
| Minimum | 9.1% | 17.0% |
| Maximum | 60.5% | 100.0% |
| Range | 51.4% | 83.0% |
| Mean | 28.2% | 42.9% |
| Median | 28.4% | 31.0% |
| Interquartile 25% (IQ1) | 21.3% | 26.7% |
| Interquartile 75% (IQ3) | 34.2% | 49.2% |
| Interquartile Range (IQR) | 12.9% | 22.5% |
| Standard Deviation (Sample) | 9.9% | 27.2% |
| Standard Deviation (Population) | 9.9% | 26.2% |
Similar Demographics by Single Mother Poverty
Demographics Similar to Guyanese by Single Mother Poverty
In terms of single mother poverty, the demographic groups most similar to Guyanese are Nicaraguan (29.8%, a difference of 0.040%), Haitian (29.8%, a difference of 0.050%), Immigrants from Thailand (29.9%, a difference of 0.090%), Irish (29.8%, a difference of 0.11%), and Liberian (29.9%, a difference of 0.12%).
| Demographics | Rating | Rank | Single Mother Poverty |
| Immigrants | Immigrants | 16.6 /100 | #204 | Poor 29.7% |
| Czechoslovakians | 16.1 /100 | #205 | Poor 29.7% |
| Immigrants | Haiti | 15.8 /100 | #206 | Poor 29.7% |
| Immigrants | Panama | 15.5 /100 | #207 | Poor 29.8% |
| Immigrants | Guyana | 14.7 /100 | #208 | Poor 29.8% |
| Irish | 13.9 /100 | #209 | Poor 29.8% |
| Haitians | 13.3 /100 | #210 | Poor 29.8% |
| Guyanese | 12.8 /100 | #211 | Poor 29.8% |
| Nicaraguans | 12.4 /100 | #212 | Poor 29.8% |
| Immigrants | Thailand | 12.0 /100 | #213 | Poor 29.9% |
| Liberians | 11.7 /100 | #214 | Poor 29.9% |
| Jamaicans | 11.7 /100 | #215 | Poor 29.9% |
| Immigrants | Western Africa | 11.5 /100 | #216 | Poor 29.9% |
| Immigrants | Ghana | 11.3 /100 | #217 | Poor 29.9% |
| Hungarians | 10.3 /100 | #218 | Poor 29.9% |
Demographics Similar to Immigrants from Switzerland by Single Mother Poverty
In terms of single mother poverty, the demographic groups most similar to Immigrants from Switzerland are Uruguayan (28.3%, a difference of 0.0%), Colombian (28.3%, a difference of 0.010%), Immigrants from Afghanistan (28.3%, a difference of 0.060%), Cypriot (28.3%, a difference of 0.10%), and Immigrants from Syria (28.3%, a difference of 0.12%).
| Demographics | Rating | Rank | Single Mother Poverty |
| Australians | 92.5 /100 | #117 | Exceptional 28.3% |
| Brazilians | 92.4 /100 | #118 | Exceptional 28.3% |
| Immigrants | Syria | 92.4 /100 | #119 | Exceptional 28.3% |
| Cypriots | 92.3 /100 | #120 | Exceptional 28.3% |
| Immigrants | Afghanistan | 92.1 /100 | #121 | Exceptional 28.3% |
| Colombians | 91.8 /100 | #122 | Exceptional 28.3% |
| Uruguayans | 91.7 /100 | #123 | Exceptional 28.3% |
| Immigrants | Switzerland | 91.7 /100 | #124 | Exceptional 28.3% |
| Kenyans | 90.9 /100 | #125 | Exceptional 28.4% |
| Immigrants | Chile | 90.8 /100 | #126 | Exceptional 28.4% |
| Poles | 90.8 /100 | #127 | Exceptional 28.4% |
| Immigrants | England | 90.5 /100 | #128 | Exceptional 28.4% |
| South Americans | 90.4 /100 | #129 | Exceptional 28.4% |
| Norwegians | 90.4 /100 | #130 | Exceptional 28.4% |
| Immigrants | Austria | 90.3 /100 | #131 | Exceptional 28.4% |