Guatemalan vs Cajun Single Female Poverty
COMPARE
Guatemalan
Cajun
Single Female Poverty
Single Female Poverty Comparison
Guatemalans
Cajuns
23.8%
SINGLE FEMALE POVERTY
0.0/ 100
METRIC RATING
282nd/ 347
METRIC RANK
30.6%
SINGLE FEMALE POVERTY
0.0/ 100
METRIC RATING
340th/ 347
METRIC RANK
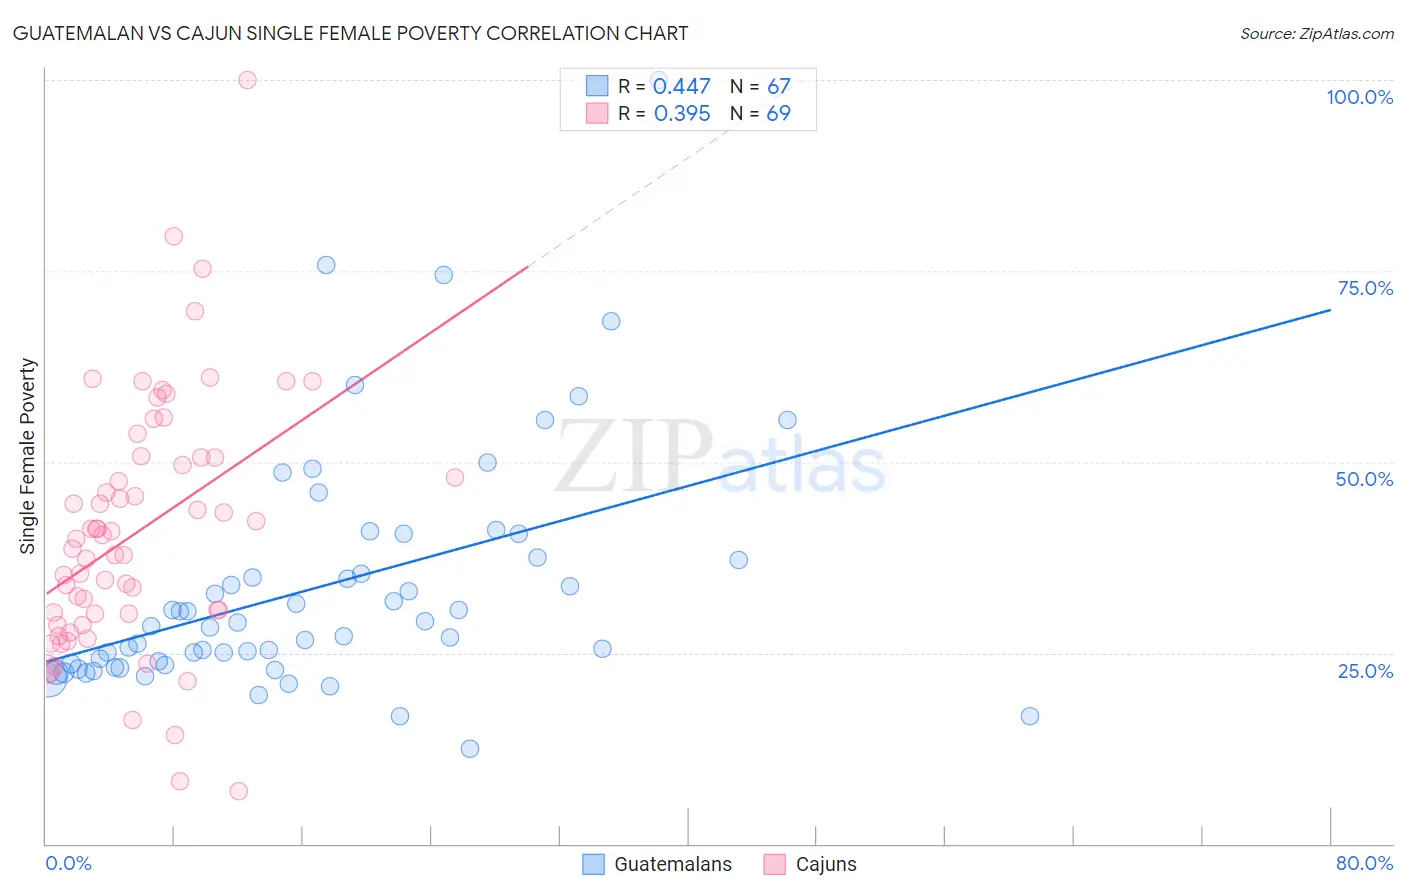
Guatemalan vs Cajun Single Female Poverty Correlation Chart
The statistical analysis conducted on geographies consisting of 404,542,149 people shows a moderate positive correlation between the proportion of Guatemalans and poverty level among single females in the United States with a correlation coefficient (R) of 0.447 and weighted average of 23.8%. Similarly, the statistical analysis conducted on geographies consisting of 148,582,163 people shows a mild positive correlation between the proportion of Cajuns and poverty level among single females in the United States with a correlation coefficient (R) of 0.395 and weighted average of 30.6%, a difference of 28.5%.
Single Female Poverty Correlation Summary
| Measurement | Guatemalan | Cajun |
| Minimum | 12.4% | 6.8% |
| Maximum | 100.0% | 100.0% |
| Range | 87.6% | 93.2% |
| Mean | 33.7% | 40.8% |
| Median | 28.4% | 39.9% |
| Interquartile 25% (IQ1) | 23.4% | 29.3% |
| Interquartile 75% (IQ3) | 37.5% | 50.5% |
| Interquartile Range (IQR) | 14.1% | 21.2% |
| Standard Deviation (Sample) | 15.8% | 16.6% |
| Standard Deviation (Population) | 15.7% | 16.5% |
Similar Demographics by Single Female Poverty
Demographics Similar to Guatemalans by Single Female Poverty
In terms of single female poverty, the demographic groups most similar to Guatemalans are Immigrants from Zaire (23.8%, a difference of 0.050%), German Russian (23.9%, a difference of 0.14%), Immigrants from Dominica (23.9%, a difference of 0.25%), Immigrants from Latin America (23.7%, a difference of 0.56%), and Alaskan Athabascan (23.6%, a difference of 1.1%).
| Demographics | Rating | Rank | Single Female Poverty |
| Mexican American Indians | 0.1 /100 | #275 | Tragic 23.4% |
| Immigrants | Azores | 0.0 /100 | #276 | Tragic 23.5% |
| Pennsylvania Germans | 0.0 /100 | #277 | Tragic 23.6% |
| Immigrants | Nonimmigrants | 0.0 /100 | #278 | Tragic 23.6% |
| Alaskan Athabascans | 0.0 /100 | #279 | Tragic 23.6% |
| Immigrants | Latin America | 0.0 /100 | #280 | Tragic 23.7% |
| Immigrants | Zaire | 0.0 /100 | #281 | Tragic 23.8% |
| Guatemalans | 0.0 /100 | #282 | Tragic 23.8% |
| German Russians | 0.0 /100 | #283 | Tragic 23.9% |
| Immigrants | Dominica | 0.0 /100 | #284 | Tragic 23.9% |
| Immigrants | Guatemala | 0.0 /100 | #285 | Tragic 24.1% |
| Cree | 0.0 /100 | #286 | Tragic 24.1% |
| Bangladeshis | 0.0 /100 | #287 | Tragic 24.2% |
| Spanish Americans | 0.0 /100 | #288 | Tragic 24.2% |
| U.S. Virgin Islanders | 0.0 /100 | #289 | Tragic 24.2% |
Demographics Similar to Cajuns by Single Female Poverty
In terms of single female poverty, the demographic groups most similar to Cajuns are Cheyenne (30.4%, a difference of 0.81%), Pima (30.3%, a difference of 1.0%), Sioux (31.3%, a difference of 2.0%), Navajo (31.7%, a difference of 3.3%), and Yuman (29.4%, a difference of 4.1%).
| Demographics | Rating | Rank | Single Female Poverty |
| Ute | 0.0 /100 | #333 | Tragic 28.4% |
| Pueblo | 0.0 /100 | #334 | Tragic 28.6% |
| Immigrants | Yemen | 0.0 /100 | #335 | Tragic 28.9% |
| Colville | 0.0 /100 | #336 | Tragic 29.1% |
| Yuman | 0.0 /100 | #337 | Tragic 29.4% |
| Pima | 0.0 /100 | #338 | Tragic 30.3% |
| Cheyenne | 0.0 /100 | #339 | Tragic 30.4% |
| Cajuns | 0.0 /100 | #340 | Tragic 30.6% |
| Sioux | 0.0 /100 | #341 | Tragic 31.3% |
| Navajo | 0.0 /100 | #342 | Tragic 31.7% |
| Crow | 0.0 /100 | #343 | Tragic 32.4% |
| Lumbee | 0.0 /100 | #344 | Tragic 33.0% |
| Houma | 0.0 /100 | #345 | Tragic 33.8% |
| Puerto Ricans | 0.0 /100 | #346 | Tragic 34.1% |
| Tohono O'odham | 0.0 /100 | #347 | Tragic 34.2% |