Immigrants from Western Asia vs Cajun Single Female Poverty
COMPARE
Immigrants from Western Asia
Cajun
Single Female Poverty
Single Female Poverty Comparison
Immigrants from Western Asia
Cajuns
19.9%
SINGLE FEMALE POVERTY
96.5/ 100
METRIC RATING
110th/ 347
METRIC RANK
30.6%
SINGLE FEMALE POVERTY
0.0/ 100
METRIC RATING
340th/ 347
METRIC RANK
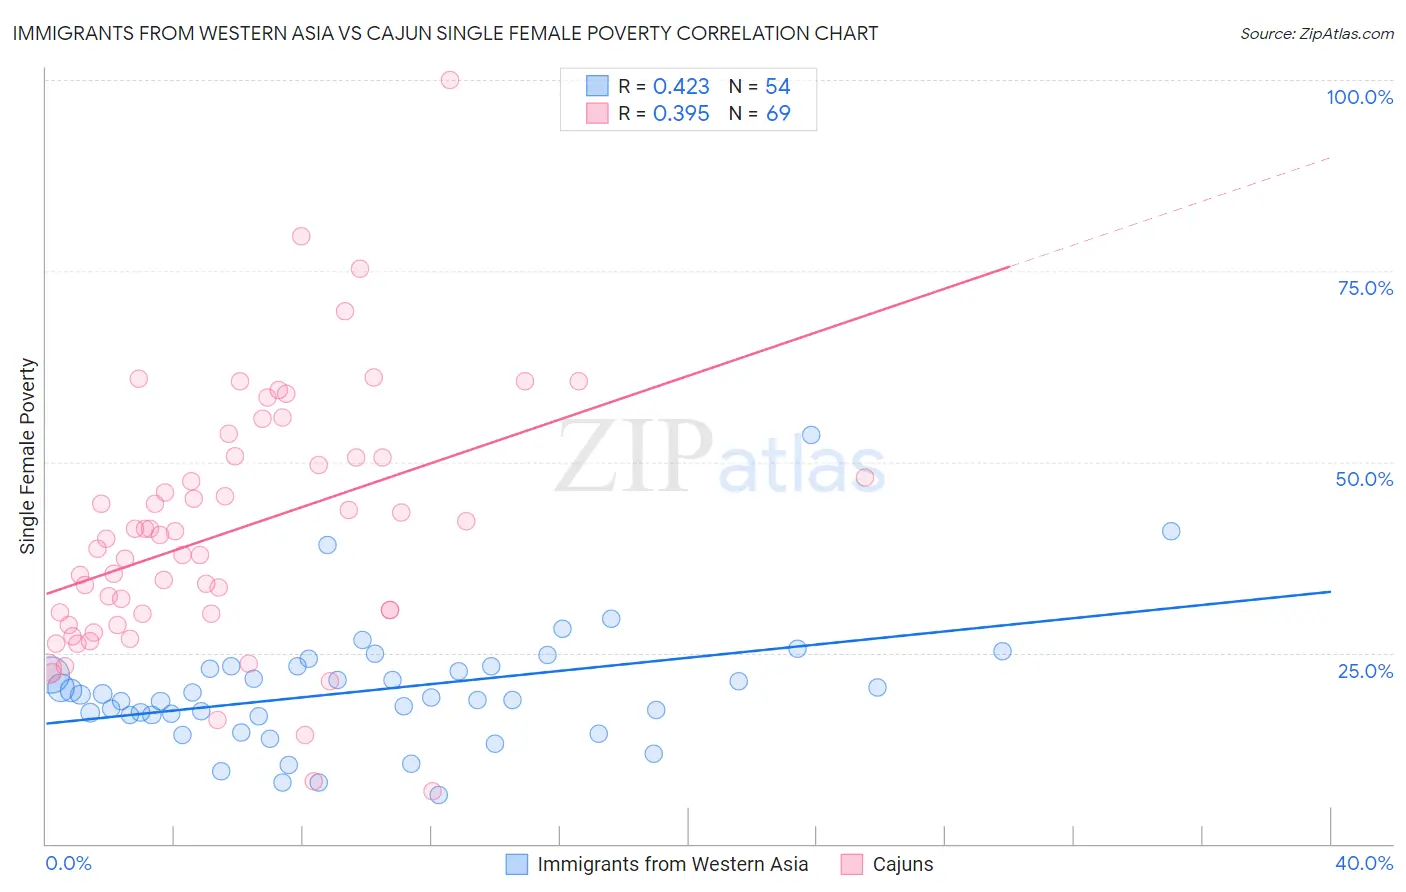
Immigrants from Western Asia vs Cajun Single Female Poverty Correlation Chart
The statistical analysis conducted on geographies consisting of 397,084,795 people shows a moderate positive correlation between the proportion of Immigrants from Western Asia and poverty level among single females in the United States with a correlation coefficient (R) of 0.423 and weighted average of 19.9%. Similarly, the statistical analysis conducted on geographies consisting of 148,582,163 people shows a mild positive correlation between the proportion of Cajuns and poverty level among single females in the United States with a correlation coefficient (R) of 0.395 and weighted average of 30.6%, a difference of 53.8%.
Single Female Poverty Correlation Summary
| Measurement | Immigrants from Western Asia | Cajun |
| Minimum | 6.4% | 6.8% |
| Maximum | 53.6% | 100.0% |
| Range | 47.2% | 93.2% |
| Mean | 20.1% | 40.8% |
| Median | 19.3% | 39.9% |
| Interquartile 25% (IQ1) | 16.8% | 29.3% |
| Interquartile 75% (IQ3) | 23.2% | 50.5% |
| Interquartile Range (IQR) | 6.4% | 21.2% |
| Standard Deviation (Sample) | 8.0% | 16.6% |
| Standard Deviation (Population) | 7.9% | 16.5% |
Similar Demographics by Single Female Poverty
Demographics Similar to Immigrants from Western Asia by Single Female Poverty
In terms of single female poverty, the demographic groups most similar to Immigrants from Western Asia are Colombian (19.9%, a difference of 0.010%), Native Hawaiian (19.9%, a difference of 0.020%), Immigrants from Syria (19.9%, a difference of 0.070%), Ethiopian (19.9%, a difference of 0.080%), and Israeli (19.9%, a difference of 0.18%).
| Demographics | Rating | Rank | Single Female Poverty |
| Immigrants | Southern Europe | 97.1 /100 | #103 | Exceptional 19.9% |
| Chileans | 96.9 /100 | #104 | Exceptional 19.9% |
| Israelis | 96.9 /100 | #105 | Exceptional 19.9% |
| Ethiopians | 96.7 /100 | #106 | Exceptional 19.9% |
| Immigrants | Syria | 96.7 /100 | #107 | Exceptional 19.9% |
| Native Hawaiians | 96.6 /100 | #108 | Exceptional 19.9% |
| Colombians | 96.6 /100 | #109 | Exceptional 19.9% |
| Immigrants | Western Asia | 96.5 /100 | #110 | Exceptional 19.9% |
| Carpatho Rusyns | 96.1 /100 | #111 | Exceptional 20.0% |
| Immigrants | Netherlands | 96.0 /100 | #112 | Exceptional 20.0% |
| Immigrants | Zimbabwe | 95.9 /100 | #113 | Exceptional 20.0% |
| Immigrants | Colombia | 95.9 /100 | #114 | Exceptional 20.0% |
| Immigrants | Northern Africa | 95.8 /100 | #115 | Exceptional 20.0% |
| Immigrants | Kazakhstan | 95.7 /100 | #116 | Exceptional 20.0% |
| Poles | 95.6 /100 | #117 | Exceptional 20.0% |
Demographics Similar to Cajuns by Single Female Poverty
In terms of single female poverty, the demographic groups most similar to Cajuns are Cheyenne (30.4%, a difference of 0.81%), Pima (30.3%, a difference of 1.0%), Sioux (31.3%, a difference of 2.0%), Navajo (31.7%, a difference of 3.3%), and Yuman (29.4%, a difference of 4.1%).
| Demographics | Rating | Rank | Single Female Poverty |
| Ute | 0.0 /100 | #333 | Tragic 28.4% |
| Pueblo | 0.0 /100 | #334 | Tragic 28.6% |
| Immigrants | Yemen | 0.0 /100 | #335 | Tragic 28.9% |
| Colville | 0.0 /100 | #336 | Tragic 29.1% |
| Yuman | 0.0 /100 | #337 | Tragic 29.4% |
| Pima | 0.0 /100 | #338 | Tragic 30.3% |
| Cheyenne | 0.0 /100 | #339 | Tragic 30.4% |
| Cajuns | 0.0 /100 | #340 | Tragic 30.6% |
| Sioux | 0.0 /100 | #341 | Tragic 31.3% |
| Navajo | 0.0 /100 | #342 | Tragic 31.7% |
| Crow | 0.0 /100 | #343 | Tragic 32.4% |
| Lumbee | 0.0 /100 | #344 | Tragic 33.0% |
| Houma | 0.0 /100 | #345 | Tragic 33.8% |
| Puerto Ricans | 0.0 /100 | #346 | Tragic 34.1% |
| Tohono O'odham | 0.0 /100 | #347 | Tragic 34.2% |