Ghanaian vs Vietnamese Married-Couple Family Poverty
COMPARE
Ghanaian
Vietnamese
Married-Couple Family Poverty
Married-Couple Family Poverty Comparison
Ghanaians
Vietnamese
5.7%
MARRIED-COUPLE FAMILY POVERTY
3.3/ 100
METRIC RATING
236th/ 347
METRIC RANK
7.4%
MARRIED-COUPLE FAMILY POVERTY
0.0/ 100
METRIC RATING
323rd/ 347
METRIC RANK
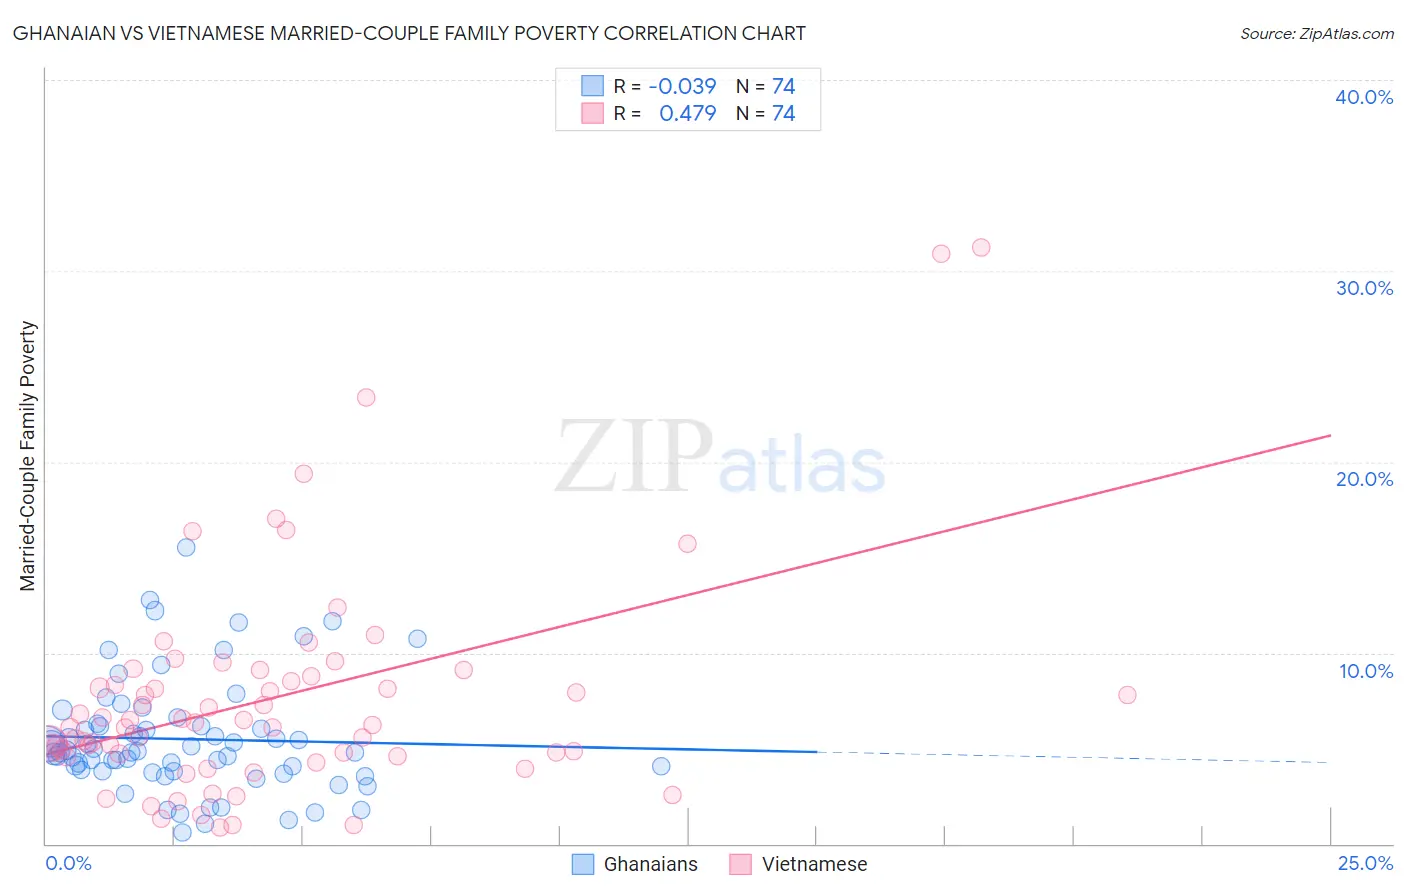
Ghanaian vs Vietnamese Married-Couple Family Poverty Correlation Chart
The statistical analysis conducted on geographies consisting of 189,762,764 people shows no correlation between the proportion of Ghanaians and poverty level among married-couple families in the United States with a correlation coefficient (R) of -0.039 and weighted average of 5.7%. Similarly, the statistical analysis conducted on geographies consisting of 170,138,931 people shows a moderate positive correlation between the proportion of Vietnamese and poverty level among married-couple families in the United States with a correlation coefficient (R) of 0.479 and weighted average of 7.4%, a difference of 29.5%.
Married-Couple Family Poverty Correlation Summary
| Measurement | Ghanaian | Vietnamese |
| Minimum | 0.61% | 0.87% |
| Maximum | 15.5% | 31.2% |
| Range | 14.9% | 30.4% |
| Mean | 5.5% | 7.6% |
| Median | 4.8% | 6.3% |
| Interquartile 25% (IQ1) | 3.8% | 4.7% |
| Interquartile 75% (IQ3) | 6.2% | 8.8% |
| Interquartile Range (IQR) | 2.4% | 4.1% |
| Standard Deviation (Sample) | 3.0% | 5.8% |
| Standard Deviation (Population) | 2.9% | 5.7% |
Similar Demographics by Married-Couple Family Poverty
Demographics Similar to Ghanaians by Married-Couple Family Poverty
In terms of married-couple family poverty, the demographic groups most similar to Ghanaians are Immigrants from Sudan (5.7%, a difference of 0.16%), Immigrants from South America (5.7%, a difference of 0.16%), Immigrants from Colombia (5.7%, a difference of 0.35%), Immigrants from Uruguay (5.7%, a difference of 0.35%), and Cherokee (5.8%, a difference of 0.53%).
| Demographics | Rating | Rank | Married-Couple Family Poverty |
| Sub-Saharan Africans | 4.9 /100 | #229 | Tragic 5.7% |
| Moroccans | 4.9 /100 | #230 | Tragic 5.7% |
| Immigrants | Iraq | 4.4 /100 | #231 | Tragic 5.7% |
| Immigrants | Laos | 4.4 /100 | #232 | Tragic 5.7% |
| Immigrants | Colombia | 3.7 /100 | #233 | Tragic 5.7% |
| Immigrants | Uruguay | 3.7 /100 | #234 | Tragic 5.7% |
| Immigrants | Sudan | 3.5 /100 | #235 | Tragic 5.7% |
| Ghanaians | 3.3 /100 | #236 | Tragic 5.7% |
| Immigrants | South America | 3.1 /100 | #237 | Tragic 5.7% |
| Cherokee | 2.7 /100 | #238 | Tragic 5.8% |
| Venezuelans | 2.7 /100 | #239 | Tragic 5.8% |
| Fijians | 2.5 /100 | #240 | Tragic 5.8% |
| Immigrants | Panama | 2.5 /100 | #241 | Tragic 5.8% |
| Immigrants | Western Africa | 2.4 /100 | #242 | Tragic 5.8% |
| Somalis | 2.3 /100 | #243 | Tragic 5.8% |
Demographics Similar to Vietnamese by Married-Couple Family Poverty
In terms of married-couple family poverty, the demographic groups most similar to Vietnamese are Immigrants from Central America (7.4%, a difference of 0.090%), Immigrants from Cuba (7.5%, a difference of 0.63%), Immigrants from Bangladesh (7.5%, a difference of 0.82%), Hispanic or Latino (7.5%, a difference of 0.82%), and Immigrants from Honduras (7.3%, a difference of 1.1%).
| Demographics | Rating | Rank | Married-Couple Family Poverty |
| Hondurans | 0.0 /100 | #316 | Tragic 7.2% |
| Mexicans | 0.0 /100 | #317 | Tragic 7.2% |
| Immigrants | Guatemala | 0.0 /100 | #318 | Tragic 7.2% |
| Immigrants | Latin America | 0.0 /100 | #319 | Tragic 7.2% |
| Immigrants | Grenada | 0.0 /100 | #320 | Tragic 7.3% |
| Immigrants | Caribbean | 0.0 /100 | #321 | Tragic 7.3% |
| Immigrants | Honduras | 0.0 /100 | #322 | Tragic 7.3% |
| Vietnamese | 0.0 /100 | #323 | Tragic 7.4% |
| Immigrants | Central America | 0.0 /100 | #324 | Tragic 7.4% |
| Immigrants | Cuba | 0.0 /100 | #325 | Tragic 7.5% |
| Immigrants | Bangladesh | 0.0 /100 | #326 | Tragic 7.5% |
| Hispanics or Latinos | 0.0 /100 | #327 | Tragic 7.5% |
| Immigrants | Mexico | 0.0 /100 | #328 | Tragic 7.6% |
| Natives/Alaskans | 0.0 /100 | #329 | Tragic 8.2% |
| Paiute | 0.0 /100 | #330 | Tragic 8.3% |